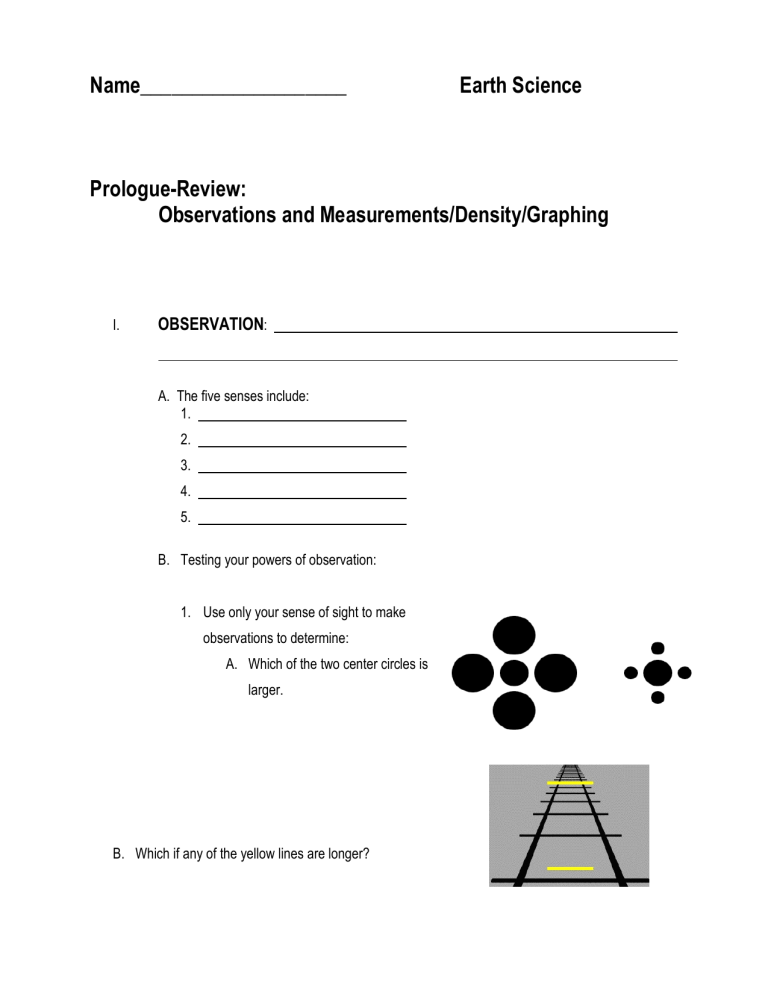
Name____________________ Earth Science Prologue-Review: Observations and Measurements/Density/Graphing I. OBSERVATION: A. The five senses include: 1. 2. 3. 4. 5. B. Testing your powers of observation: 1. Use only your sense of sight to make observations to determine: A. Which of the two center circles is larger. B. Which if any of the yellow lines are longer? C. Which if any of the pairs of lines are parallel? D. Are any of the gray horizontal lines parallel? E. Is this a young woman or an old woman? 2. How can we determine if our power of observation using only sight was accurate? • 3. Check to determine if you were accurate. How many observations (using only sight) did you have correct? C. Our powers of observation are limited by our senses. D. can be used to improve or extend our powers of observation. These devices have been invented by people to , and thus enable us to make observations that would otherwise be impossible or highly inaccurate. 2 E. Examples: 3 F. Which instruments can be used to accurately measure each of these? 1. 3. 2. II. Inference - A. For example, if you observed the appearance of more and more clouds that were darker and darker in color, you might infer that: B. List the observations and inferences that you can make based on this picture: Observations: Inferences: 4 C. Identify each statement as either an observation or an inference: 1. a. The dog is growling. b. The dog is angry. 2. a. The pebble is smooth and rounded. b. The pebble was carried by a stream. c. The pebble is light brown in color. 3. a. By tomorrow, the stream will overflow it’s banks. b. The river is high, muddy and flowing swiftly. c. The rainfall has been continuous and is very heavy. 4. a. The tire has a leak. b. The tire is flat. 5. a. There is a track on this trail. b. The track was made by a large deer. III. Classification A. A classification system is based on . B. A classification system enables an investigator to IV. Measurement A. A measurement is a way of expressing an observation with greater precision. It provides a numerical value for some property of the object or the event being observed. 1. All measurements consist of: (a) (b) 5 1. Properties that can be measured include; length, area, volume, mass, weight, temperature, density, time, etc. B. Linear Measurement (or “one dimensional”) – 1. Instrument – 2. Unit – Metric a) centi – 1/100 meter centimeters = 1 meter b) milli – 1/1000 meter millimeters = 1 meter c) kilo – 1000 meters kilometer = 1000 m 3. Using the model below, give the value of each dot to the nearest one (1.0) millimeter, and then convert to centimeters. A B C D E A millimeters, or centimeters B millimeters, or centimeters C millimeters, or centimeters D millimeters, or centimeters E millimeters, or centimeters F millimeters, or centimeters G millimeters, or centimeters F G 4. Measure each line segment to the nearest tenth of a centimeter (0.1) and then convert to millimeters. (a.) cm or mm (b.) cm or mm (c.) cm or mm (d.) cm or mm (e.) cm or mm 6 C. Area (or 2-dimensional measurement)1. Instrument – 2. Formula: 3. Units: Square units a) Sq. cm or 4. Determine the area of each figure below. cm2 (a) (b) cm2 D. Volume (or 3-Dimensional measurement sometimes referred to as the “size” of an object) – 1. Volume of liquids a) Instrument – _______________________________ b) Units – _______________________ 2. Volume of rectangular solids a) Instrument: b) Formula: c) Units – cubic units 1. Cu. Cm or d) cubic cm = or milliliter 7 e) Determine the volume of the objects in each illustration: Answer: Answer: 3. Volume by displacement: E. Mass – 1. Instrument – 2. Units: (a) F. Weight - 8 G. Density – 1. Formula: in ESRT Units: (a) (b) 4. Solve the density problems in your notes: 1.0 cm to the right. Given that this object has a mass of 150 grams, 2.0CM (a) The dimensions of a rectangular solid object are given as illustrated determine the density of the object. 5.0 cm 9 (b) The initial volume in a graduated cylinder measures 40 ml, a small pebble is placed in the graduated cylinder and the water rises to 65 ml. The mass of the pebble is 80 grams. What is the density of the pebble? (c) Object Y is a perfect cube. The density of object Y is 5.5 g/cm3 and the mass is 44.0 g. Calculate the volume of the cube. Since Object Y is a perfect cube, determine the length of each side of the cube. (d) The diagram shows equal masses of four different earth materials at different temperatures. Which material has the greatest density? 1. water 2. iron 3. granite 4. dry air (e) The table below shows properties of 4 different minerals. If the mass of a spinel crystal is 9.5 grams, what is the volume of this spinel crystal? 1. 2. 3. 4. 0.4 cm3 2.5 cm3 5.7 cm3 36.1 cm3 10 (f) As shown in the diagram, an empty 1,000.-milliliter container has a mass of 250.0 grams. When filled with a liquid, the container and the liquid have a combined mass of 1,300. grams. What is the density of the liquid? 1. 2. 3. 4. 1.00 g/mL 1.05 g/mL 1.30 g/mL 0.95 g/mL (g) A pebble has a mass of 35 grams and a volume of 14 cubic centimeters. What is its density? 1. 2. 3. 4. 0.4 g/cm3 2.5 g/cm3 490 g/cm3 4.0 g/cm3 (h) The data table below shows the density of four different mineral samples. A student accurately measured the mass of a sample of one of the four minerals to be 294.4 grams and its volume to be 73.6 cm3. Which mineral sample did the student measure? 1. 2. 3. 4. corundum galena hematite quartz 11 H. The Changing Environment- Graphing 1. An important feature of any graph is that it shows the general nature of the _______________________ between two variables. 2. Variables are _________________ used on a graph that represent the 2 changes taking place. 3. Graphs can show (1) a _____________ relationship, (2) an ____________ relationship, or (3) a ____________ relationship. 4. In a direct relationship, as one variable _________________ (usually the independent variable) the second variable also _________________ (usually the dependent). In a direct relationship, the line on the graph slants _______________ from left to right. 5. In an inverse relationship, as one variable __________________ (usually the independent variable), the second variable _________________ (usually the dependent variable). In an inverse relationship, the line of the graph slants __________________ from left to right. 6. In a cyclic relationship, as one variable __________________ (usually the independent variable), the second variable _________________ and _________________ repeatedly at regular intervals. In a cyclic relationship, the line of the graph goes _________________ in a wave-like pattern. 12 7. Interpolate- Inter means __________________. When you are asked to interpolate data from a graph you need to read between the values already known on the graph. This is simply graph reading. What would the mass be for a 300 ml sample of the material shown below on the graph? 8. Extrapolate- Extra means ____________________. When you are asked to extrapolate data from a graph you need to estimate outside the observed range of values on the graph. What would the volume be for a 500 g sample of the material shown above on the graph? 13 Complete the following exercises: A. Graph the following data on the graph below. X- Water Temperature (°C) 15 16 17 18 19 20 21 22 23 24 Y- Fish Count in Pond (per km2) 1000 900 810 730 640 500 430 370 300 250 1. What happens to the fish count when the water temperature increases? ____________________ _____________________________________________________________________________ 2. What type of relationship is shown by the graph? ______________________________________ 3. What is your prediction for: (a) 25 °C: ________________ (b) 14 °C: ____________________ 14 B. Graph the following data on the graph provided below. X- Age (years) 6 7 8 9 10 11 12 13 14 15 16 Y- Avg. Weight of Male Students 49 58 70 80 91 104 115 130 142 151 158 1. What happens to the average weight of students when their age increases? __________________ 2. What type of relationship is shown by the graph? _______________________________________ 3. What is your prediction for: (a) age 17: ____________________ (b) age 5: __________________ 15 C. Graph the following data on the graph provided below. X- Time (hours) 0 2 4 6 8 10 12 14 16 18 20 22 24 Y- Tidal Height (meters) 2.2 2.5 2.2 1.5 0.8 1.0 1.8 2.5 2.2 1.5 0.8 1.0 1.5 1. What type of relationship is shown by the graph? _______________________________________ 2. What do you predict for the tidal height at (a) hour 5:______________ (b) hour 19:_____________ 16
