Forecasting Analysis: Moving Averages & Trend Smoothing
advertisement

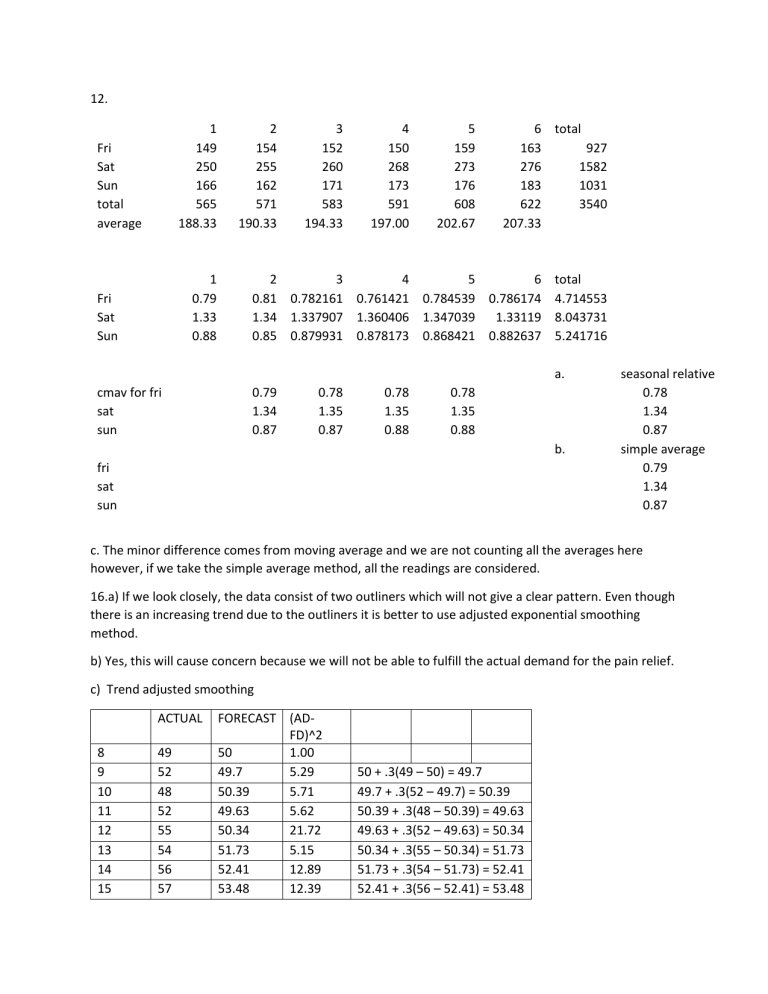
12. 1 149 250 166 565 188.33 Fri Sat Sun total average 1 0.79 1.33 0.88 Fri Sat Sun 2 154 255 162 571 190.33 3 152 260 171 583 194.33 4 150 268 173 591 197.00 5 159 273 176 608 202.67 6 total 163 927 276 1582 183 1031 622 3540 207.33 2 3 4 5 6 total 0.81 0.782161 0.761421 0.784539 0.786174 4.714553 1.34 1.337907 1.360406 1.347039 1.33119 8.043731 0.85 0.879931 0.878173 0.868421 0.882637 5.241716 a. cmav for fri sat sun 0.79 1.34 0.87 0.78 1.35 0.87 0.78 1.35 0.88 0.78 1.35 0.88 b. fri sat sun seasonal relative 0.78 1.34 0.87 simple average 0.79 1.34 0.87 c. The minor difference comes from moving average and we are not counting all the averages here however, if we take the simple average method, all the readings are considered. 16.a) If we look closely, the data consist of two outliners which will not give a clear pattern. Even though there is an increasing trend due to the outliners it is better to use adjusted exponential smoothing method. b) Yes, this will cause concern because we will not be able to fulfill the actual demand for the pain relief. c) Trend adjusted smoothing ACTUAL 8 9 10 11 12 13 14 15 49 52 48 52 55 54 56 57 FORECAST (ADFD)^2 50 1.00 49.7 5.29 50.39 5.71 49.63 5.62 50.34 21.72 51.73 5.15 52.41 12.89 53.48 12.39 50 + .3(49 – 50) = 49.7 49.7 + .3(52 – 49.7) = 50.39 50.39 + .3(48 – 50.39) = 49.63 49.63 + .3(52 – 49.63) = 50.34 50.34 + .3(55 – 50.34) = 51.73 51.73 + .3(54 – 51.73) = 52.41 52.41 + .3(56 – 52.41) = 53.48 16 54.53 TOTAL MSE 53.48 + .3(57-53.48) =54.53 69.77 69.77/7= ± 9.96 Case1 M&L Manufacturing case 1.A formalized approach will make the production planning for the computer easier and data can be quantified to allow the correct number of inventories stored in the facility. If this method is not used, personal biasness may be involved that will hinder the overall forecast. When there is huge amount of data, forecasting cannot be done depending upon less formalized method because an individual’s intuition will not be able to analyze huge set of data. Since the company was facing frequent stock out a formalized approach of forecasting will help them to conduct proper inventory management and control over stock levels, reduce uncertainty factors by a considerable amount and fewer stock outs in retail stores. 2.PRODUCT 1 TOTAL PERIOD T 1 2 3 4 5 6 7 8 9 10 11 12 13 14 105 Product 1Y 50 54 57 60 64 67 71.5 76 79 82 85 87 92 96 1020.5 TY T^2 50 108 171 240 320 402 500.5 608 711 820 935 1044 1196 1344 8449.5 1 4 9 16 25 36 49 64 81 100 121 144 169 196 1015 m= (14*8449.5)-(105*1020.5)/(14*1015)-(105*105) = 3.5 c= 1020.5-(3.5*105)/14 = 46.64 equation- Ft = 46.64 + 3.5t F15= 46.64 + 3.5*15=99.14 F16= 46.64 + 3.5*16=102.64 F17= 46.64 + 3.5*17=106.14 F18= 46.64 + 3.5*18=109.64 Justification – For product 1 at period of 7 we can see there is a demand of 90 units and if we look at the overall data there is an increasing trend which is the reason behind using trend equation method. However, an unexceptional rise on period 7 which can be taken as an outliner since all the other values are quite closer to each other. To remove this, we can take an average demand of the previous and the next week’ data.so the demands becomes (67+76)/2= 71.5. Product 2 For 15 exponential method44+ 0.5(44-43)=44.5 For 16 average method (43+44+44.5)/3 = 43.8 For 17 (44+44.5+43.8)/3 = 44.1 For 18 (44.5+43.8+44)/3 = 44.06 Justification – for product 2 the data did not show any particular trend which is why exponential smoothing method was used followed by average method. Case2 Highline Financial Services, Ltd. service A quarter 1 2 3 4 year 1 60 45 100 75 year 2 72 51 112 85 difference 12 6 12 10 service B quarter 1 2 year 1 95 85 year 2 85 -7 difference next forecast + difference -10 75 -10 65 next forecast + difference 84 56 124 95 3 4 92 65 85 50 -7 -15 78 35 service C quarter 1 2 3 4 year 1 93 90 110 90 year 2 102 75 110 100 difference 9 -15 0 10 next forecast + difference 111 60 110 110 Justification- here the data is not showing either increasing or decreasing trend so a liner trend equation cannot be used. There is an unexceptional rise in demand for both service A and B during third quarter which can be taken as an outliner. Moreover, service C has genuine increase in demand and the values are higher in comparison to A and B. In the forecasted data for service B there was a decreasing trend which shows a concern about their future performance, so the company has room for improvement. For C there was no general improvement in the forecasted data which shows that the company needs to improve its service in order to be better.


