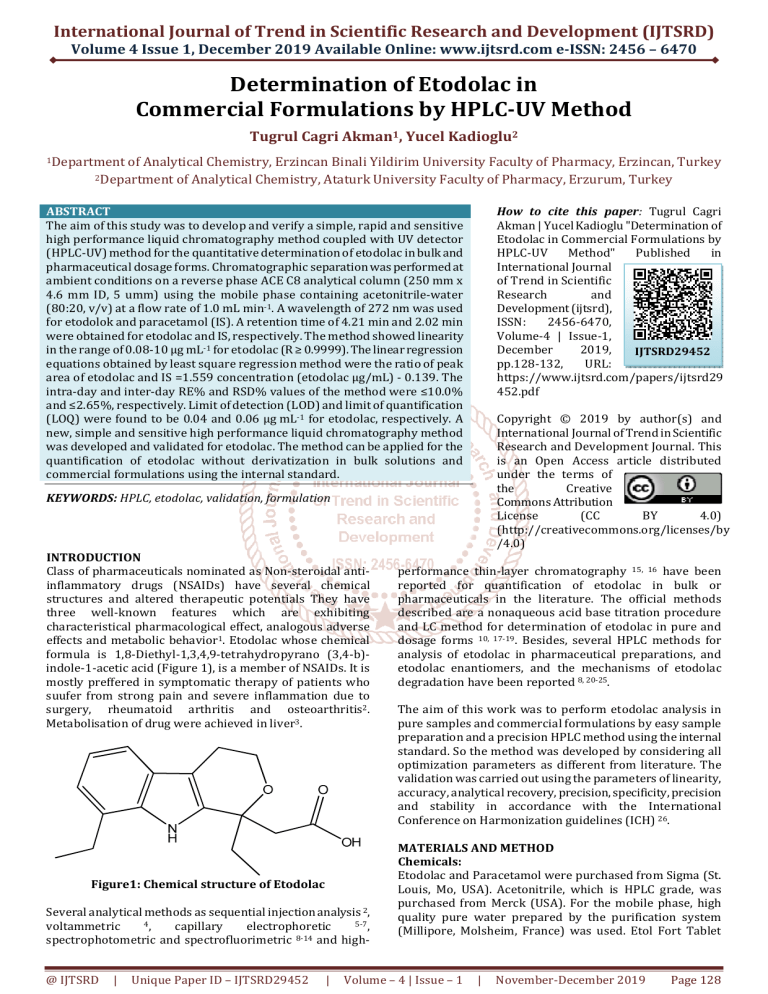
International Journal of Trend in Scientific Research and Development (IJTSRD) Volume 4 Issue 1, December 2019 Available Online: www.ijtsrd.com e-ISSN: 2456 – 6470 Determination of Etodolac in Commercial Formulations by HPLC-UV Method Tugrul Cagri Akman1, Yucel Kadioglu2 1Department of Analytical Chemistry, Erzincan Binali Yildirim University Faculty of Pharmacy, Erzincan, Turkey of Analytical Chemistry, Ataturk University Faculty of Pharmacy, Erzurum, Turkey 2Department ABSTRACT The aim of this study was to develop and verify a simple, rapid and sensitive high performance liquid chromatography method coupled with UV detector (HPLC-UV) method for the quantitative determination of etodolac in bulk and pharmaceutical dosage forms. Chromatographic separation was performed at ambient conditions on a reverse phase ACE C8 analytical column (250 mm x 4.6 mm ID, 5 umm) using the mobile phase containing acetonitrile-water (80:20, v/v) at a flow rate of 1.0 mL min-1. A wavelength of 272 nm was used for etodolok and paracetamol (IS). A retention time of 4.21 min and 2.02 min were obtained for etodolac and IS, respectively. The method showed linearity in the range of 0.08-10 µg mL-1 for etodolac (R ≥ 0.9999). The linear regression equations obtained by least square regression method were the ratio of peak area of etodolac and IS =1.559 concentration (etodolac µg/mL) - 0.139. The intra-day and inter-day RE% and RSD% values of the method were ≤10.0% and ≤2.65%, respectively. Limit of detection (LOD) and limit of quantification (LOQ) were found to be 0.04 and 0.06 μg mL-1 for etodolac, respectively. A new, simple and sensitive high performance liquid chromatography method was developed and validated for etodolac. The method can be applied for the quantification of etodolac without derivatization in bulk solutions and commercial formulations using the internal standard. How to cite this paper: Tugrul Cagri Akman | Yucel Kadioglu "Determination of Etodolac in Commercial Formulations by HPLC-UV Method" Published in International Journal of Trend in Scientific Research and Development (ijtsrd), ISSN: 2456-6470, Volume-4 | Issue-1, December 2019, IJTSRD29452 pp.128-132, URL: https://www.ijtsrd.com/papers/ijtsrd29 452.pdf Copyright © 2019 by author(s) and International Journal of Trend in Scientific Research and Development Journal. This is an Open Access article distributed under the terms of the Creative Commons Attribution License (CC BY 4.0) (http://creativecommons.org/licenses/by /4.0) KEYWORDS: HPLC, etodolac, validation, formulation INTRODUCTION Class of pharmaceuticals nominated as Non-steroidal antiinflammatory drugs (NSAIDs) have several chemical structures and altered therapeutic potentials They have three well-known features which are exhibiting characteristical pharmacological effect, analogous adverse effects and metabolic behavior1. Etodolac whose chemical formula is 1,8-Diethyl-1,3,4,9-tetrahydropyrano (3,4-b)indole-1-acetic acid (Figure 1), is a member of NSAIDs. It is mostly preffered in symptomatic therapy of patients who suufer from strong pain and severe inflammation due to surgery, rheumatoid arthritis and osteoarthritis2. Metabolisation of drug were achieved in liver3. Figure1: Chemical structure of Etodolac Several analytical methods as sequential injection analysis 2, 4, 5-7, voltammetric capillary electrophoretic spectrophotometric and spectrofluorimetric 8-14 and high@ IJTSRD | Unique Paper ID – IJTSRD29452 | performance thin-layer chromatography 15, 16 have been reported for quantification of etodolac in bulk or pharmaceuticals in the literature. The official methods described are a nonaqueous acid base titration procedure and LC method for determination of etodolac in pure and dosage forms 10, 17-19. Besides, several HPLC methods for analysis of etodolac in pharmaceutical preparations, and etodolac enantiomers, and the mechanisms of etodolac degradation have been reported 8, 20-25. The aim of this work was to perform etodolac analysis in pure samples and commercial formulations by easy sample preparation and a precision HPLC method using the internal standard. So the method was developed by considering all optimization parameters as different from literature. The validation was carried out using the parameters of linearity, accuracy, analytical recovery, precision, specificity, precision and stability in accordance with the International Conference on Harmonization guidelines (ICH) 26. MATERIALS AND METHOD Chemicals: Etodolac and Paracetamol were purchased from Sigma (St. Louis, Mo, USA). Acetonitrile, which is HPLC grade, was purchased from Merck (USA). For the mobile phase, high quality pure water prepared by the purification system (Millipore, Molsheim, France) was used. Etol Fort Tablet Volume – 4 | Issue – 1 | November-December 2019 Page 128 International Journal of Trend in Scientific Research and Development (IJTSRD) @ www.ijtsrd.com eISSN: 2456-6470 (Nobel Ilac A.Ş.) and Tadolak Tablet (Saba Ilac A.Ş.), which were obtained from local pharmacies (Erzurum, Turkey), contained 400 mg etodolac. Equipment and Chromatographic Conditions: Chromatographic analysis was implemented on An Agilent 1200 series HPLC system, consisting of a quaternary pump, UV detector, a degasser and autosampler. Chromatographic separation was performed at ambient conditions on a reverse phase ACE C8 analytical column (250 mm x 4.6 mm ID, 5 umm). The best separation was obtained using the mobile phase containing acetonitrile-water (80:20, v/v) at a flow rate of 1.0 mL min-1. The enjection volume was 10 μL. The mobile phase was used after filtration through a 0.22 μm membrane filter (Millipore). For etodolok and IS, a wavelength of 272 nm was used and the etodolac and IS peak areas of each concentration were determined by the Agilent ChemStation software program. Etodolac and IS peak area ratios of the solutions at each concentration were calculated. Preparation Of Calibration Standards And Quality Control Solutions: 5 mg of ethodolac was dissolved with 50 ml of acetonitrile. Solution with a final concentration of 100 μg ml-1 was used as the standard stock solution of etodolac. From this stock solution, working standard (WS) solutions (0.08, 0.5, 1.0, 2.5, 5.0 and 10.0 μg mL-1) and quality control solutions (0.1, 4.5 and 9.5 μg mL-1) were prepared by appropriate dilution in a 10 mL volumetric flask. QC samples were analyzed for assessing the precision and accuracy parameters. The paracetamol solution (100 μg mL-1) used as the internal standard (IS) was diluted with acetonitrile to 1.0 μg mL-1. Tablets: Separately 20 Etol fort tablets and Tadolak tablets were carefully weighed and pulverized in mortar. Correct weights equivalent to 400 mg of ethodolac were dissolved in 100 mL of acetonitrile. The solution was allowed to stand for about 10-15 minutes, then filtered through 12 mm filter paper. The filtrate was diluted with acetonitrile to obtain an etodolac concentration of 0.5, 4.0 and 8.0 μg mL-1 for both tablet samples. RESULTS System Suitability: Sample of etodolac at a concentration of 5.0 μg mL-1 was analyzed by six replicates for assessing the system suitability. The acceptance criterion for system suitability was the percentage of standard deviation (% RSD) ± 2% for retention time and peak area of etodolac (Table 1). Column yield expressed by the number of theoretical plates (N) was 6712 ± 2% and the tail factor (T) was 1.11 ± 0.04 (mean ± RSD) for six replicates of injections. Retention time (min) a Peak areaa 4.21 27.58 SD 0.12 0.55 RSD % 1.64 1.99 aBased on six analysis Table 1 System suitability study of method (5.0 μg mL-1) Linearity / Range: The method developed for etodolac was found to have a linearity in the concentration range of 0.08 to 10 μg mL-1 in six replicates at six concentrations (0.08, 0.5, 1.0, 2.5, 5.0 and 10 μg mL-1). Linearity is shown by linear regression analysis. At least square regression method was preferred for the necessary calculations. The linear regression equation [with standard error of intercept (Sa: 0.022) and slope (Sb: 0.0064)] and the correlation coefficient, R, was found to be y=1.559 x-0.139 (y: the ratio of peak areas of etodolac and IS; x: the concentration of etodolac) and 0.9999, respectively (Figure 2). Figure 2: HPLC chromatograms of standard solutıons of Etodolac (0.08, 0.5, 1.0, 2.5, 5.0 and 10.0 µg mL-1) and IS (1.0 µg mL -1) Limit of Detection and Limit of Quantification: Under optimized conditions, the limit of detection (LOD) and limit of quantification (LOQ) parameters were used to determine the sensitivity of the method. In the method, LOD defined as signal / noise = 3 was determined as 0.04 μg mL-1 and LOQ defined as signal / noise = 10 was determined as 0.06 μg mL-1. These values were considered appropriate for both accuracy and precision parameters (% RSD <20%). Precision and Accuracy: The precision and accuracy were determined by intra-day and inter-day analysis of QC samples at 0.1, 4.5 and 9.5 μg mL-1 concentrations. Intra-day accuracy and precision studies were evaluated by six replicates analysis of QCs on the same day. In the inter-day studies, the same QC samples were analyzed on different days (10 days) and compared. The precision was @ IJTSRD | Unique Paper ID – IJTSRD29452 | Volume – 4 | Issue – 1 | November-December 2019 Page 129 International Journal of Trend in Scientific Research and Development (IJTSRD) @ www.ijtsrd.com eISSN: 2456-6470 calculated by RSD%, and the accuracy was determined by percent relative error (% RE). % RE expressed as a percentage of the average deviation from the known concentration. The RSD values for the precision were ≤2.65% (n=6). For the accuracy of the method, % RE values were found to be ≤10% (Table 2). Intra-day Inter-day Added (µ µg mL-1) Found± ±SD (µ µg mL-1) RSD % RE % Found± ±SD (µ µg mL-1) RSD% RE% 0.1 1.08 -7.00 0.91 10.00 0.093±0.001 0.11±0.001 4.5 2.65 0.67 2.45 -0.22 4.53±0.12 4.49±0.11 9.5 1.16 0.21 0.95 -0.11 9.52±0.11 9.49±0.09 SD: Standard deviation, RSD: Relative Standard Deviation, RE: Relative error, average of six replicate determinations Table 2: Precision and accuracy of the proposed method (n=6) Analytical Recovery: The standard addition method was used to calculate analytical recovery. A standard sample solution at a concentration of 1.0 μg mL-1 was added to tablet solutions of three different concentrations (0.5, 4.0 and 8.0 μg mL-1) and tested by HPLC-UV method. The analytical recovery was calculated using the following equation: Analytical Recovery % = [(Ct-Cu) / Ca] x 100 Cu indicates the concentration of the analyte in the tablet solutions and Ca indicates the standard analyte concentration put into the formulation. Ct is the total concentration of analyte in the prepared samples. The mean recovery percentage obtained was 98.0% and 101.0% for both tablets. The results showed that the method had good analytical recovery. Any interference was detected with the excipients in the preparation. RSD% values of recovery was between 1.32% to 3.23% (Table 3). Taken (µ µg mL-1) Found±SD (µ µg mL-1) Recovery % (RSD%) 0.5 1.51±0.02 101.0 (1.32) Etol Fort Tablet 1.0 4.0 4.99±0.08 99.0 (1.60) 8.0 8.99±0.29 99.0 (3.23) 0.5 1.48±0.04 98.0 (2.70) Tadolak Tablet 1.0 4.5 5.49±0.08 99.0 (1.46) 8.5 9.48±0.24 98.0 (2.53) SD: Standard deviation of six replicate determinations, RSD: Relative standard deviation Table 3: Analytical recovery values of Etodolac in tablet (n=6) Commercial Formulations Added (µ µg mL-1) Application Of The Method For Analysis Of Commercial Formulations: The developed method was applied to two commercial preparations containing 400 mg of etodolac. According to the regression equation there is no statistically important difference between each calibration curves of the standard solution and commercial formulation. Six replicate analyzes confirmed that the tablets contained 400 mg of etodolac. HPLC chromatograms from commercial formulations are shown in Figure 3. Figure 3: HPLC Chromatograms of solutions of commercial formulations The results exhibited that the parameters of accuracy, precision and recovery from the pharmaceutical preparations were very good (Table 4). It has also been shown that there is no interference from the excipients in the pharmaceutical preparation to the results of the analysis. According to the analyzes repeated six times, the final recovery for each commercial preparation was about 99.95% and the RSD% was 4.25%. (n=6) @ IJTSRD | Unique Paper ID – IJTSRD29452 | Volume – 4 | Issue – 1 | November-December 2019 Page 130 International Journal of Trend in Scientific Research and Development (IJTSRD) @ www.ijtsrd.com eISSN: 2456-6470 Commercial Formulations Label claim Mean±SD Recovery (%) RSD (%) Etol Fort Tablet 400 mg 399.9±16.2 99.9 4.05 Tadolak Tablet 400 mg 400.1±17.8 100.0 4.45 Table 4: Determination of Etodolac in commercial formulations (n=6) SD: Standard deviation of six replicate determinations, RSD: Relative standard deviation DISCUSSION Etodolac is a member of NSAIDs. In the proposed work, HPLC combined with UV detection was optimized and validated for quantitative analysis of etodolac without derivatization in pharmaceuticals using internal standard. HPLC method is mostly applied in pharmacopoeia analysis. For instance, the chromatographic seperation was preferred for the purity analysis and the quantitative determination of pharmaceuticals. On the other hand, this method can often be used to perform quality control analyzes. Separation of enantiomers of etodolac using two different derivitization agents and three chiral stationary phases has been studied by HPLC method which was converted to its anilide derivative with either 1,3-dicyclohexyl-carbodiimide or 1-(3-dimethylaminopropyl)-3-ethylcarbodiimide hydrochloride 25. A isocratic chromatographic method for the separation, identification, and measurement of etodolac enantiomers using chiral stationary phase columns has been reported 24. In another study, a HPLC method has been developed to measure etodolac in presence of three main degradants, 7-ethyl-2-(1-methylene-propyl)-1-H-indole-3ethanol, the decarboxylated product of etodolac, and 7ethyltryptophol 23. A reversed-phase liquid chromatographic (RP-HPLC) method has also been proposed for the simultaneous determination of two substances in an oral formulation containing tolperisone hydrochloride (TOLP) and etodolac (ETD) 22. However, Ficarra et al. also proposed the HPLC method for etodolac measurement in tablet formulation 20. Chromatographic separation was actualized at 30 oC using a mobile phase of pH 6.0 phosphate buffer / methanol (60/40 v/v) and a C18 column (3.3 cm x 0.46 cm i.d.) at a flow rate of 1 mL min-1. Etodolac detection was performed at 230 nm using a UV detector. Diazepam was used as an internal standard. They have been extracted with methanol the etodolac from tablets. A retention time of 1.46 min was obtained for etodolac under these conditions, and the method was found to be linear, precise and accurate over the concentration range of 0.01 to 0.1 mg mL-1. In this proposed study, C8 column at ambient temperature and also asetonitril/water (80/20, v/v) as mobile phase and paracetamol as internal standard was used. Etodolac was detected at 272 nm wavelength on the basis of UV detection. A retention time of etodolac and IS were 4.21 min and 2.02 min under these conditions, respectively. Current study was accepted in terms of linearity, precision and accuracy parameters regarding to ICH criteria. It is also revealed that analytical recovery of the proposed method is in acceptable range ( %98-101). CONCLUSIONS A rapid, specific, simple and accurate method has been successfully developed and validated in accordance with the ICH guidance. Proposed method was also applied onto commercial pharmaceuticals as Tadolak and Etol Fort. Thus, it is claimed that validated current procedure could be reliably used in routine analysis of both bulk samples and pharmaceutical preparations in quality control laboratories. @ IJTSRD | Unique Paper ID – IJTSRD29452 | CONFLICTS OF INTERESTS The authors declare no conflict of interest there are no conflicts, financial or otherwise. REFERENCES [1] Gouda, A. A., et al., Spectrophotometric and spectrofluorometric methods for the determination of non-steroidal anti-inflammatory drugs: a review. Arabian Journal of Chemistry, 2013. 6(2): p. 145-163. [2] Garcia, J. B., M. L. M. Saraiva, and J. L. Lima, Determination and antioxidant activity evaluation of etodolac, an anti-inflammatory drug, by sequential injection analysis. Analytica chimica acta, 2006. 573: p. 371-375. [3] Strickmann, D. B. and G. Blaschke, Isolation of an unknown metabolite of the non-steroidal antiinflammatory drug etodolac and its identification as 5hydroxy etodolac. Journal of pharmaceutical and biomedical analysis, 2001. 25(5-6): p. 977-984. [4] Yılmaz, S., B. Uslu, and S. A. Özkan, Anodic oxidation of etodolac and its square wave and differential pulse voltammetric determination in pharmaceuticals and human serum. Talanta, 2001. 54(2): p. 351-360. [5] de Pablos, R. R., et al., Separation of etodolac enantiomers by capillary electrophoresis. Validation and application of the chiral method to the analysis of commercial formulations. Electrophoresis, 2005. 26(6): p. 1106-1113. [6] Dung, P. T., et al., Determination of enantiomeric impurity of etodolac by capillary electrophoresis using (2-hydroxypropyl)-β-cyclodextrin. Archives of pharmacal research, 2008. 31(9): p. 1218-1223. [7] D, D. -A., et al., Capillary electrophoretic method for the determination of etodolac in pharmaceutical tablet formulation. Journal of liquid chromatography & related technologies, 2001. 24(6): p. 773-780. [8] Saleh, O. A., et al., Development and validation of stability-indicating high performance liquid chromatographic (HPLC) and DD1-spectrophotometric assays for etodolac in bulk form and in pharmaceutical dosage form. Journal of Liquid Chromatography & Related Technologies®, 2009. 32(17): p. 2584-2599. [9] El-Hay, S. S. A., et al., Spectrofluorimetric determination of etodolac, moxepril HCl and fexofenadine HCl using europium sensitized fluorescence in bulk and pharmaceutical preparations. Journal of fluorescence, 2012. 22(1): p. 247-252. [10] Ulu, S. T., New and Sensitive Spectrofluorimetric Method for the Determination of Non-Steroidal Anti inflammatory Drugs, Etodolac and Diclofenac Sodium in Pharmaceutical Preparations through Derivatization with 7-fluoro-4-nitrobenzo-2-oxa-1, 3-diazole. Journal of Food & Drug Analysis, 2011. 19(1). Volume – 4 | Issue – 1 | November-December 2019 Page 131 International Journal of Trend in Scientific Research and Development (IJTSRD) @ www.ijtsrd.com eISSN: 2456-6470 [11] Duymus, H., et al., Charge transfer complex studies between some non-steroidal anti-inflammatory drugs and π-electron acceptors. Spectrochimica Acta Part A: Molecular and Biomolecular Spectroscopy, 2006. 65(5): p. 1120-1124. [12] SM, A., et al., Spectrophotometric study of etodolac complexes with copper (II) and iron (III). Journal of AOAC International, 2005. 88(6): p. 1637-1643. [13] Gouda, A. A. and W. S. Hassan, Spectrophotometric determination of etodolac in pure form and pharmaceutical formulations. Chemistry Central Journal, 2008. 2(1): p. 7. [14] El Kousy, N., Spectrophotometric and spectrofluorimetric determination of etodolac and aceclofenac. Journal of pharmaceutical and biomedical analysis, 1999. 20(1-2): p. 185-194. [15] Sane, R., M. Francis, and A. Khatri, High-performance thin-layer chromatographic determination of etodolac in pharmaceutical preparations. JPC. Journal of planar chromatography, modern TLC, 1998. 11(3): p. 211-213. [16] Lalla, J., et al., HPTLC determination of etodolac in pharmaceutical formulations and human samples: HPTLC vs HPLC. INDIAN DRUGS-BOMBAY-, 1999. 36: p. 115-122. [17] Commission, B. P., G. M. Council, and G. B. M. Commission, British pharmacopoeia. Vol. 1. 2001: Her Majesty's Stationery Office. [18] Monograph, R., European Pharmacopoeia. European Directorate for the Quality of Medicine & Health Care of the Council of Europe (EDQM), edn, 2008. 9: p. 31043105. [20] Ficarra, P., M. CALABRO, and D. Costantino, Quantitative high-performance liquid chromatographic determination of etodolac in pharmaceutical formulations. Il Farmaco, 1991. 46(2): p. 403-407. [21] Ammar, A. and P. Surmann, Improvement of the etodolac purity test by reversed phase highperformance liquid chromatography. Die PharmazieAn International Journal of Pharmaceutical Sciences, 2008. 63(12): p. 913-914. [22] Patel, M. J., R. Badmanaban, and C. Patel, Reversed phase-high performance liquid chromatographic method for simultaneous estimation of tolperisone hydrochloride and etodolac in a combined fixed dose oral formulations. Pharmaceutical methods, 2011. 2(2): p. 124-129. [23] Lee, Y. J., J. Padula, and H. K. Lee, Kinetics and mechanisms of etodolac degradation in aqueous solutions. Journal of pharmaceutical sciences, 1988. 77(1): p. 81-86. [24] Caccamese, S., Direct high-performance liquid chromatography (HPLC) separation of etodolac enantiomers using chiral stationary phases. Chirality, 1993. 5(3): p. 164-167. [25] Pirkle, W. H. and P. G. Murray, The Separation of the Enantiomers of a Variety of Non-Steroidal AntiInflammatory Drugs Nsaids) as Their Anilide Derivatives Using a Chiral Stationary Phase. Journal of liquid chromatography, 1990. 13(11): p. 2123-2134. [26] Hubert, P., et al., Harmonization of strategies for the validation of quantitative analytical procedures: a SFSTP proposal—part I. Journal of pharmaceutical and biomedical analysis, 2004. 36(3): p. 579-586. [19] Convention, U. S. P. The United States Pharmacopeia: The National Formulary. 1980. United States pharmacopeial convention. @ IJTSRD | Unique Paper ID – IJTSRD29452 | Volume – 4 | Issue – 1 | November-December 2019 Page 132
