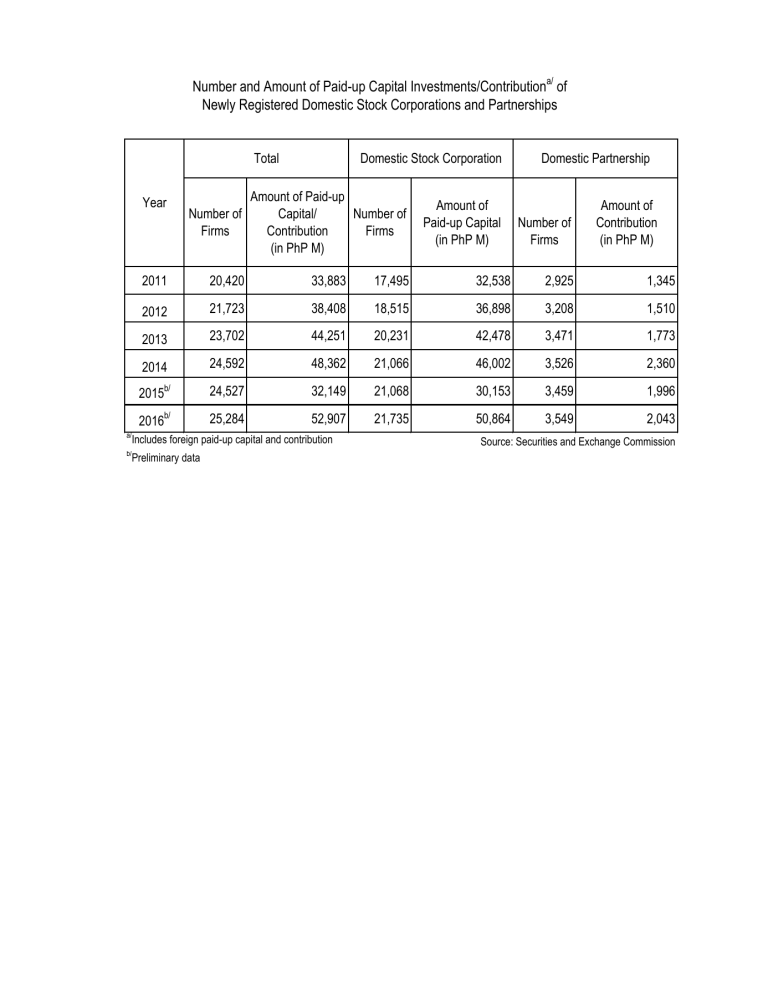
Number and Amount of Paid-up Capital Investments/Contributiona/ of Newly Registered Domestic Stock Corporations and Partnerships Total Year Domestic Stock Corporation Amount of Paid-up Number of Capital/ Number of Firms Contribution Firms (in PhP M) Number of Firms Amount of Contribution (in PhP M) 2011 20,420 33,883 17,495 32,538 2,925 1,345 2012 21,723 38,408 18,515 36,898 3,208 1,510 2013 23,702 44,251 20,231 42,478 3,471 1,773 2014 24,592 48,362 21,066 46,002 3,526 2,360 2015b/ 24,527 32,149 21,068 30,153 3,459 1,996 2016b/ 25,284 52,907 21,735 50,864 3,549 2,043 a/ Includes foreign paid-up capital and contribution b/ Amount of Paid-up Capital (in PhP M) Domestic Partnership Preliminary data Source: Securities and Exchange Commission


