Inflation, Output Gap, and Monetary Policy Exam Question
advertisement
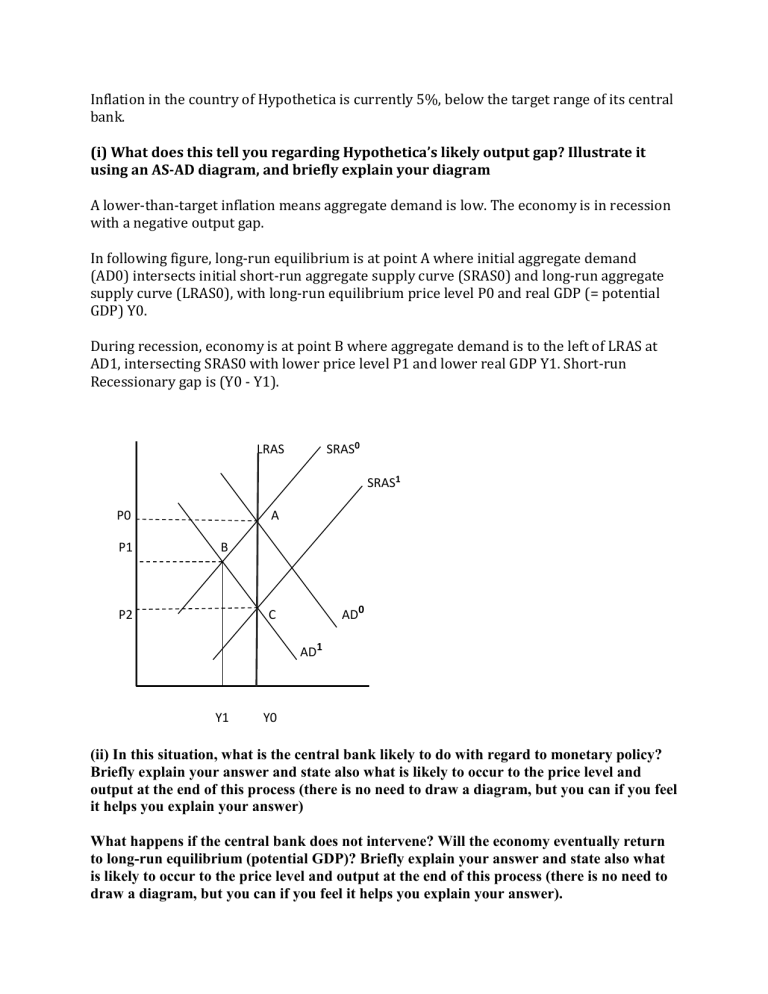
Inflation in the country of Hypothetica is currently 5%, below the target range of its central bank. (i) What does this tell you regarding Hypothetica’s likely output gap? Illustrate it using an AS-AD diagram, and briefly explain your diagram A lower-than-target inflation means aggregate demand is low. The economy is in recession with a negative output gap. In following figure, long-run equilibrium is at point A where initial aggregate demand (AD0) intersects initial short-run aggregate supply curve (SRAS0) and long-run aggregate supply curve (LRAS0), with long-run equilibrium price level P0 and real GDP (= potential GDP) Y0. During recession, economy is at point B where aggregate demand is to the left of LRAS at AD1, intersecting SRAS0 with lower price level P1 and lower real GDP Y1. Short-run Recessionary gap is (Y0 - Y1). SRAS0 LRAS SRAS1 P0 P1 A B P2 AD0 C AD1 Y1 Y0 (ii) In this situation, what is the central bank likely to do with regard to monetary policy? Briefly explain your answer and state also what is likely to occur to the price level and output at the end of this process (there is no need to draw a diagram, but you can if you feel it helps you explain your answer) What happens if the central bank does not intervene? Will the economy eventually return to long-run equilibrium (potential GDP)? Briefly explain your answer and state also what is likely to occur to the price level and output at the end of this process (there is no need to draw a diagram, but you can if you feel it helps you explain your answer). Central bank should increase money supply by following expansionary monetary policy tools: 1. Conduct open market purchase of government securities, 2. Reduce required reserve ratio or 3. Reduce discount rate. Any of these tools will increase aggregate demand, shifting AD1 rightward to AD0, ensuring long run equilibrium at point A. Without intervention in long run, lower price level will decrease prices of inputs, raising production costs. Firms will increase production, which increases aggregate supply. SRAS shifts rightward, intersecting new AD curve at further lower price level and real GDP being restored to the potential GDP. In above figure, SRAS0 shifts right to SRAS1, intersecting AD1 at point C with further lower price level P2 and restoring real GDP to potential GDP level Y0.

