RESEARCH DESIGN DECISIONS AND BE COMPETENT IN THE PROCESS
OF RELIABLE DATA COLLECTION AND ANALYSIS
Dr. Nancy Agens, Head,
Technical Operations, Statswork
Brief
the planning for the materials and the
logistics involved follows this. Similarly, in
research as well, the researcher chooses his
data collection process based on his
Research design decision. It enables the
researcher to prioritize his work, create
better questionnaires and arrive at
conclusions with greater clarity.
Research Design may be described as the
researcher’s scheme of outlining the flow
of his project. It is based on research
design, that the researcher goes about
gathering data to answer his research
question. If the idea is to complete a
building, then it has to be decided whether
it is going to be an apartment, stand-alone
house or a shopping complex, who are its
occupants? and what are the materials
needed? The plan of the project, namely
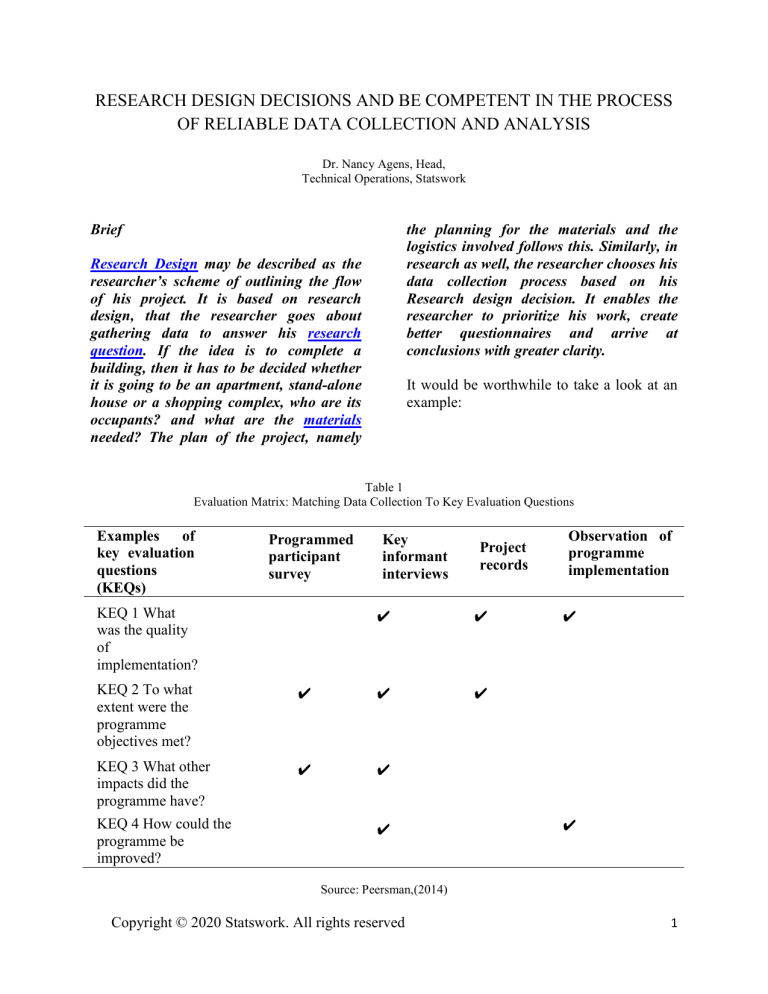
It would be worthwhile to take a look at an
example:
Table 1
Evaluation Matrix: Matching Data Collection To Key Evaluation Questions
Examples
of
key evaluation
questions
(KEQs)
Programmed
participant
survey
KEQ 1 What
was the quality
of
implementation?
Key
informant
interviews
✔
✔
✔
KEQ 2 To what
extent were the
programme
objectives met?
✔
✔
KEQ 3 What other
impacts did the
programme have?
✔
✔
KEQ 4 How could the
programme be
improved?
Project
records
✔
Observation of
programme
implementation
✔
✔
Source: Peersman,(2014)
Copyright © 2020 Statswork. All rights reserved
1
In the above diagram, table1 shows
the type of questions and the data collection
methods that were used for the same. For
instance, Key informant interviews and
Project records were used for collecting
information on the quality of the
implementation.
Quantitative
research
design
may
be
sub-divided
into
experimental, Quasi-experimental, Survey
and Correlational, while, Qualitative
research may be divided into Ethnography,
Case study, Historical and Narrative.
Broadly, RD can be classified into
Exploratory and Conclusive. Exploratory
research is
a research conducted
for
a problem that has not been studied more
clearly, intended to establish priorities,
develop operational definitions and improve
the final research design.(Shields &
Rangarajan, 2013) It does not seek to arrive
at a conclusion. Conclusive Research can be
classified into descriptive and causal.
Descriptive research tries to answer
questions such as what and How? While,
Causal research tries to establish the causeeffect relationships among the variables of
the research.
Table 2
Major Differences Between Exploratory And Conclusive Research Design
Research
project Exploratory research
components
Research purpose
General: to generate insights about a
situation
Data needs
Vague
Data sources
Ill defined
Data collection form
Open-ended, rough
Sample
Relatively small; subjectively selected to
maximize generalization of insights
Data collection
Flexible; no set procedure
Data analysis
Informal; typically non-quantitative
Inferences/
More tentative than final
Recommendations
Conclusive research
Specific: to verify insights and aid in
selecting a course of action
Clear
Well defined
Usually structured
Relatively large; objectively selected to
permit generalization of findings
Rigid; well-laid-out procedure
Formal; typically quantitative
More final than tentative
Source: Pride-Ferrell,(2006)
I. DATA COLLECTION TECHNIQUES
AND HOW TO CHOOSE ONE
Using a mix of both Qualitative and
Quantitative methods can be most beneficial.
The most widely used data collection
techniques
are
Interviews
and
Questionnaires. Interviews may be one to
one or in groups. The Questionnaire is
developed with the research question in
Copyright © 2020 Statswork. All rights reserved
mind. But it is very difficult to determine if
the participant is lying or not. Hence
reliability is a problem here.
Here are a few tips on developing
effective survey Questionnaires:
1. Ensure that that the length of the survey
questionnaire does not run to more than
five minutes.
2. Avoid complicating the Questionnaire
by using questions which may refer to
2
answers of previous questions. For
instance, ‘If your answer was yes to Q.
No 3 then…’.
3. Take care to see that the Questions don’t
look biased. ‘You would not refer XYZ
Baby oil to your friend. Would you?’
4. Ensure that you keep the Demographics
in mind and use uncomplicated words.
5. Make sure that the questions do not
carry conflicting ideas, such as ‘Which
is the best and cheapest restaurant in
town?’ The best restaurant need not be
the cheapest.
Using Data Collection tools such as
‘Device Magic’ which helps you to pre fill
form data. ‘Fulcrum’ allows for custom
maps with geo location while ‘Fast Field’
enables exporting to word and pdf. ‘Magpi’
has features for interactive data collection.
‘Zapier’ helps automate the Data Collection
process.
II. DATA ANALYSIS
Probability and non-probability
methods are used in Data Analysis.
Probability sampling uses random or semirandom methods to select a sample from
among the given population and it uses
Statistical generalization with a margin for
error as no sample will exactly reflect the
population exactly.
Random Sampling uses a simple
process where there is equal likelihood of
every member from the sample being chosen.
Stratified Random Sampling uses a method
of segregating the sample into mutually
exclusive groups and then selecting simple
random samples from a stratum.
Example:
Strata1: Gender
Male
Female
Strata2: Income
<1 lakh
1 to 2 lakhs
2-5lakhs
In the above sample we can choose
females with income range of 1 to 2 lakhs
using simple random sampling. We are now
able to make inferences across these 3 strata.
After stratifying the population, simple
random sampling is used to generate the
complete sample.
Among non-probability sampling
methods Purposive sampling is used where
particular cases which are information-rich
are selected with a view to drawing
inferences
about
the
population.
Convenience sampling is used only in cases
of insufficient data.
Copyright © 2020 Statswork. All rights reserved
Strata3: Occupation
Self-employed
Clerical
Professional
Mixing methods can improve
credibility of the research findings as each
data source possesses its own limitations and
advantages and triangulating data from
different sources or integrating different
collection methods will help answer the
research question more accurately.
Some methods of Numerical analysis
are given below:
3
Table 3. Some Methods Of Numerical Analysis
Numeric analysis
Analysing numeric data such as cost, frequency or physical characteristics. Options include:
Correlation: a statistical technique to determine how strongly two or more variables are
related.
Cross tabulations: obtaining an indication of the frequency of two variables (e.g.,
gender and frequency of school attendance) occurring at the same time.
Data and text mining: computer-driven automated techniques that run through large
amounts of text or data to find new patterns and information.
Exploratory techniques: taking a ‘first look’ at a data set by summarizing its main
characteristics, often through the use of visual methods.
Frequency tables: arranging collected data values in ascending order of magnitude, along
with their corresponding frequencies, to ensure a clearer picture of a data set.
Measures of central tendency: a summary measure that attempts to describe a whole
set of data with a single value that represents the middle or centre of its distribution.
Measures of dispersion: a summary measure that describes how values are distributed
around the center.
Multivariate descriptive: providing simple summaries of (large amounts of) information
(or data) with two or more related variables.
Non-parametric inferential: data that are flexible and do not follow a normal distribution.
Parametric inferential: carried out on data that follow certain parameters. The data
will be normal (i.e., the distribution parallels the bell curve); numbers can be added,
subtracted, multiplied and divided; variances are equal when comparing two or more
groups; and the
sample should be large and randomly selected.
Summary statistics: providing a quick summary of data, which is particularly
useful for comparing one project to another, before and afterwards.
Time series analysis: observing well defined data items obtained through
repeated measurements over time.
Textual analysis
Analysing words, either spoken or written, including questionnaire responses, interviews and
documents. Options include:
Content analysis: reducing large amounts of unstructured textual content into manageable
data relevant to the (evaluation) research questions.
Thematic coding: recording or identifying passages of text or images linked by a common
theme or idea, allowing the indexation of text into categories.
Narratives: construction of coherent narratives of the changes occurring for an
individual, a community, a site or a programme or policy.
Timelines: a list of key events, ordered chronologically.
Source: Peersman,(2014)
Copyright © 2020 Statswork. All rights reserved
4
REFERENCES
[1] Peersman, G. (2014). Overview: Data Collection and
Analysis
Methods
in
Impact
Evaluation:
Methodological Briefs-Impact Evaluation No. 10.
Retrieved
from
https://ideas.repec.org/p/ucf/metbri/innpub755.html
[2] -Ferrell. (2006). Foundations of marketing. McGrawHill
Education
London.
Retrieved
from
http://www.shermanchui.com/upload/file/20161020/
1476955790263897.pdf
[3] Shields, P. M., & Rangarajan, N. (2013). A playbook for
research
methods:
Integrating
conceptual
frameworks and project management. New Forums
Press.
Retrieved
from
https://www.researchgate.net/publication/263046108
_A_Playbook_for_Research_Methods_Integrating_
Conceptual_Frameworks_and_Project_Management
Copyright © 2020 Statswork. All rights reserved
5


