IRJET-Optimal Placement of Compensation for Load Stability Improvement using FVSI
advertisement

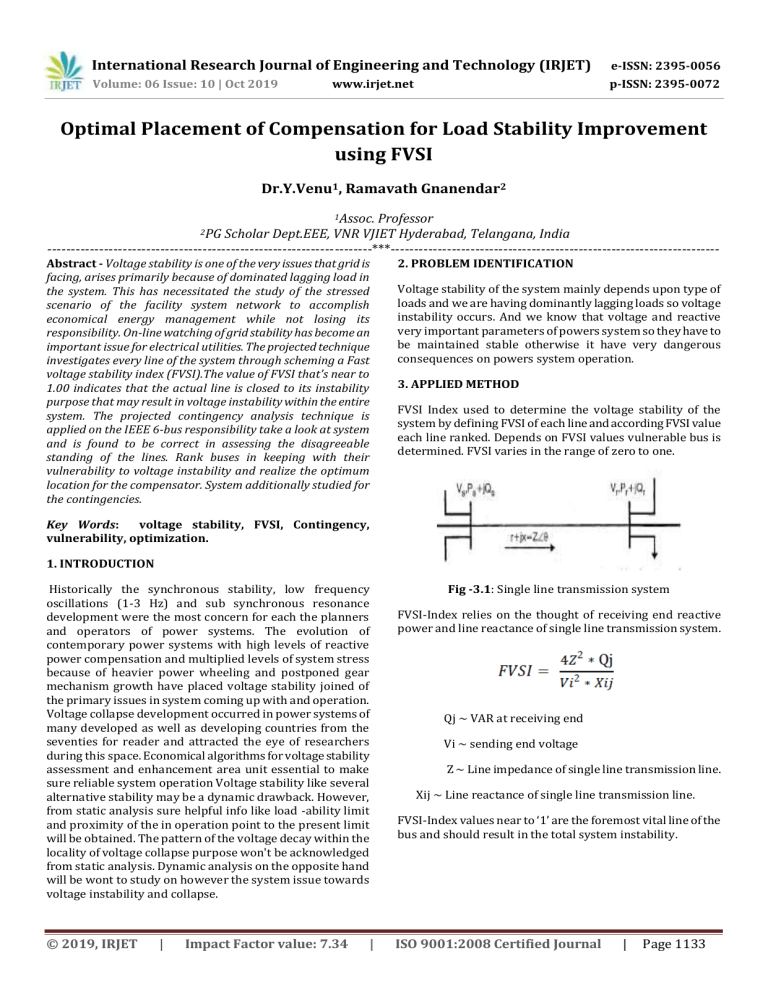
International Research Journal of Engineering and Technology (IRJET) e-ISSN: 2395-0056 Volume: 06 Issue: 10 | Oct 2019 p-ISSN: 2395-0072 www.irjet.net Optimal Placement of Compensation for Load Stability Improvement using FVSI Dr.Y.Venu1, Ramavath Gnanendar2 1Assoc. Professor Scholar Dept.EEE, VNR VJIET Hyderabad, Telangana, India ---------------------------------------------------------------------***---------------------------------------------------------------------2PG Abstract - Voltage stability is one of the very issues that grid is facing, arises primarily because of dominated lagging load in the system. This has necessitated the study of the stressed scenario of the facility system network to accomplish economical energy management while not losing its responsibility. On-line watching of grid stability has become an important issue for electrical utilities. The projected technique investigates every line of the system through scheming a Fast voltage stability index (FVSI).The value of FVSI that's near to 1.00 indicates that the actual line is closed to its instability purpose that may result in voltage instability within the entire system. The projected contingency analysis technique is applied on the IEEE 6-bus responsibility take a look at system and is found to be correct in assessing the disagreeable standing of the lines. Rank buses in keeping with their vulnerability to voltage instability and realize the optimum location for the compensator. System additionally studied for the contingencies. 2. PROBLEM IDENTIFICATION Voltage stability of the system mainly depends upon type of loads and we are having dominantly lagging loads so voltage instability occurs. And we know that voltage and reactive very important parameters of powers system so they have to be maintained stable otherwise it have very dangerous consequences on powers system operation. 3. APPLIED METHOD FVSI Index used to determine the voltage stability of the system by defining FVSI of each line and according FVSI value each line ranked. Depends on FVSI values vulnerable bus is determined. FVSI varies in the range of zero to one. Key Words: voltage stability, FVSI, Contingency, vulnerability, optimization. 1. INTRODUCTION Historically the synchronous stability, low frequency oscillations (1-3 Hz) and sub synchronous resonance development were the most concern for each the planners and operators of power systems. The evolution of contemporary power systems with high levels of reactive power compensation and multiplied levels of system stress because of heavier power wheeling and postponed gear mechanism growth have placed voltage stability joined of the primary issues in system coming up with and operation. Voltage collapse development occurred in power systems of many developed as well as developing countries from the seventies for reader and attracted the eye of researchers during this space. Economical algorithms for voltage stability assessment and enhancement area unit essential to make sure reliable system operation Voltage stability like several alternative stability may be a dynamic drawback. However, from static analysis sure helpful info like load -ability limit and proximity of the in operation point to the present limit will be obtained. The pattern of the voltage decay within the locality of voltage collapse purpose won't be acknowledged from static analysis. Dynamic analysis on the opposite hand will be wont to study on however the system issue towards voltage instability and collapse. © 2019, IRJET | Impact Factor value: 7.34 | Fig -3.1: Single line transmission system FVSI-Index relies on the thought of receiving end reactive power and line reactance of single line transmission system. Qj ~ VAR at receiving end Vi ~ sending end voltage Z ~ Line impedance of single line transmission line. Xij ~ Line reactance of single line transmission line. FVSI-Index values near to ‘1’ are the foremost vital line of the bus and should result in the total system instability. ISO 9001:2008 Certified Journal | Page 1133 International Research Journal of Engineering and Technology (IRJET) e-ISSN: 2395-0056 Volume: 06 Issue: 10 | Oct 2019 p-ISSN: 2395-0072 www.irjet.net 4. RESULTS 4.3 CONTINGENCY OF LINE 2-6 BAR CHART FOR FVSI OF THE LINES WITH OUTAGE OF LINE 2-6 0.9 0.8 0.7 FVSI 0.6 0.5 0.4 0.3 0.2 0.1 Fig 4.1: IEEE Six bus system 0 4.1 CASE 1 2 3 4 5 6 LINES 7 8 9 10 11 Fig 4.3.1 Bar chart for FVSI of line for line outage 2-3 shunt compensator Optimal Location BUS-5 BAR CHART FOR FVSI OF THE LINES FOR BASE CASE 0.8 4.4 CONTINGENCY OF LINE 4-5 0.7 0.6 BAR CHART FOR FVSI OF THE LINES WITH OUTAGE OF LINE 4-5 0.7 FVSI 0.5 0.6 0.4 0.3 0.5 0.2 FVSI 0.4 0.1 0.3 0 1 2 3 4 5 6 LINES 7 8 9 10 11 0.2 0.1 Fig 4.1.1 Bar chart for FVSI of the lines 0 1 Shunt compensator Optimal Location BUS-6 4.2 CONTINGENCY OF LINE 2-3 2 3 4 5 6 LINES 7 8 9 10 11 Fig 4.4.1 Bar chart for FVSI of line for line outage 4-5 Shunt compensator optimal location BUS-6 BAR CHART FOR FVSI OF THE LINES WITH OUTAGE OF LINE 2-3 0.8 4.5. CONTINGENCY LINES 1-5&2-3 0.7 0.6 FVSI BAR CHART FOR FVSI OF THE LINES WITH OUTAGE OF LINES 1-5&2-3 0.5 1 0.4 0.9 0.8 0.3 0.7 0.2 0.6 0 FVSI 0.1 1 2 3 4 5 6 LINES 7 8 9 10 11 0.5 0.4 0.3 Fig 4.2.1 Bar chart for FVSI of line for line outage 2-3 0.2 Optimal Location for the placement of shunt compensator BUS-6 0.1 0 1 2 3 4 5 6 LINES 7 8 9 10 11 Fig 4.5.1 Bar chart for FVSI of line for line outage 1-5&2-3 Shunt compensator Optimal Location BUS-6 © 2019, IRJET | Impact Factor value: 7.34 | ISO 9001:2008 Certified Journal | Page 1134 International Research Journal of Engineering and Technology (IRJET) e-ISSN: 2395-0056 Volume: 06 Issue: 10 | Oct 2019 p-ISSN: 2395-0072 www.irjet.net 4.6 CONTINGENCYiLINESi3-5&3-6 BIOGRAPHIES Dr. Y. Venu, Assoc. Professor Dept.EEE, VNR VJIET Hyderabad, Telangana, India. BAR CHART FOR FVSI OF THE LINES WITH OUTAGE OF LINES 3-5&3-6 1 0.9 0.8 0.7 Ramavath Gnanendar PG Scholor, Dept. EEE, VNR VJIET Hyderabad, Telangana, India. FVSI 0.6 0.5 0.4 0.3 0.2 0.1 0 1 2 3 4 5 6 LINES 7 8 9 10 11 Fig 4.6.1 Bar chart for FVSI of the lines outage of line 35&3-6 Shunt compensator Optimal Location BUS - 4 CONCLUSION Optimal location for placement of shunt compensation is decided for regular IEEE SIX bus system using MATLAB program by scheming FVSI for all the different lines and they are ranked based on the FVSI values and the value closest to 1.00 which line leads to voltage instability and this line connected load bus is treated as vulnerable bus and that bus treated as optimal location for shunt compensation. REFERENCES [1] Moghavvemi and O. Faruque, "Real-time contingency evaluation and ranking technique, "IEEE Transactions on Power Systems, vol. 145, no. 5, pp. 517-524, 1998 [2] B. Gao, G. K. Morison, and P. Kundur, “Voltage stability analysis using Static and dynamic approaches,” IEEE Transactions on Power Systems, vol. 8, no. 3, pp. 1159 1171, Aug. 1993. [3] Moghavvemi, M.: ‘New method for indicating voltage stability condition in power: system’. Proceedings of IEE international Power engineering conference IPEC’07, Singapore, pp. 223-227. [4] Kessel,Z., and Glavistch, H.: ‘Estimating the voltage stability of a power system’, ZEE Trans. Power Deliv., 2006, PWRD-1, (3), pp. 346-354 [5] CHEN, Y.L., CHANG, C.W., and LIU, C.C.: ‘Efficient methods for identifying weak nodes in electrical power networks’, ZEE Proc. C, Gener. Transm.Distrib. 1995, 142, (3), pp. 317-322. © 2019, IRJET | Impact Factor value: 7.34 | ISO 9001:2008 Certified Journal | Page 1135


