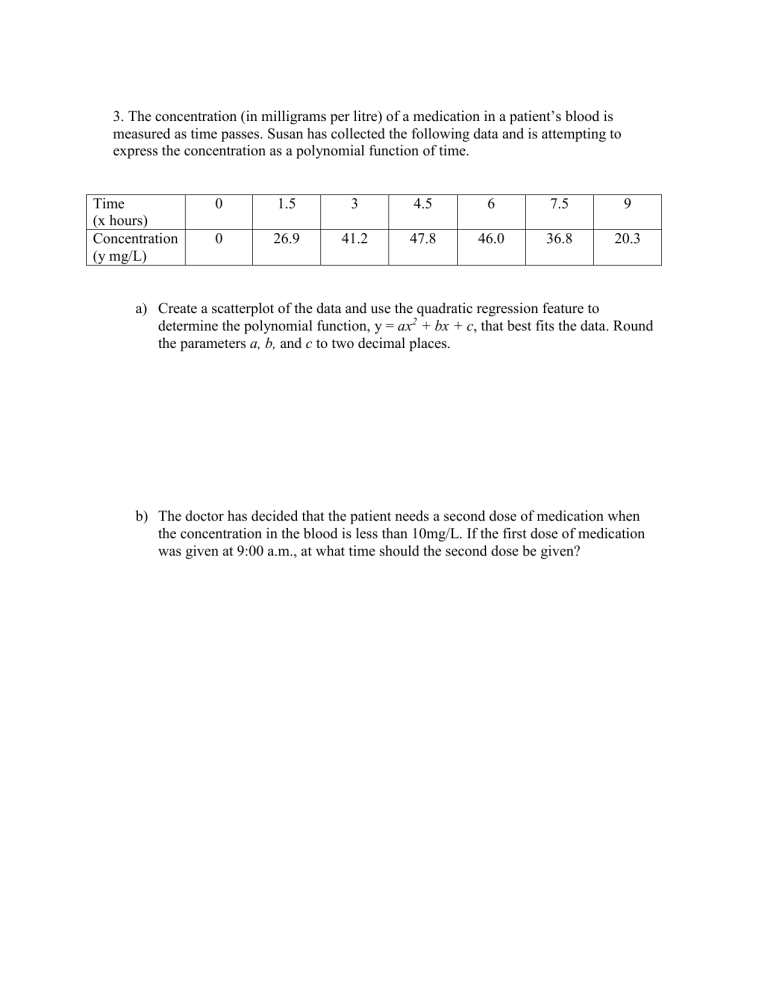
3. The concentration (in milligrams per litre) of a medication in a patient’s blood is measured as time passes. Susan has collected the following data and is attempting to express the concentration as a polynomial function of time. Time (x hours) Concentration (y mg/L) 0 1.5 3 4.5 6 7.5 9 0 26.9 41.2 47.8 46.0 36.8 20.3 a) Create a scatterplot of the data and use the quadratic regression feature to determine the polynomial function, y = ax2 + bx + c, that best fits the data. Round the parameters a, b, and c to two decimal places. b) The doctor has decided that the patient needs a second dose of medication when the concentration in the blood is less than 10mg/L. If the first dose of medication was given at 9:00 a.m., at what time should the second dose be given? 4. A research student was investigating the relationship between job satisfaction, x, (as measured by an employee on a scale from 1 to 10), and productivity, y, (as measured by the employer on a scale of 1 to 100). Data from 12 employees is given in the table. Job Satisfaction 3 8 7 5 9 6 6 10 8 2 5 7 Productivity 44 81 75 66 90 70 71 98 75 25 68 77 a) The student looked at the scatterplot and suggested that the productivity could be expressed as a linear function of job satisfaction. Perform a linear regression on the data and determine a relationship in the form y = ax + b, giving a and b to two decimal places. b) Another student looked at the scatterplot and suggested that the relationship could be represented by a cubic function with a point of inflection. Perform a cubic regression on the data and determine a relationship in the form y = ax3 + bx2 + cx + d, giving a, b, c, and d to two decimal places. c) Which model do you think best represents the data?


