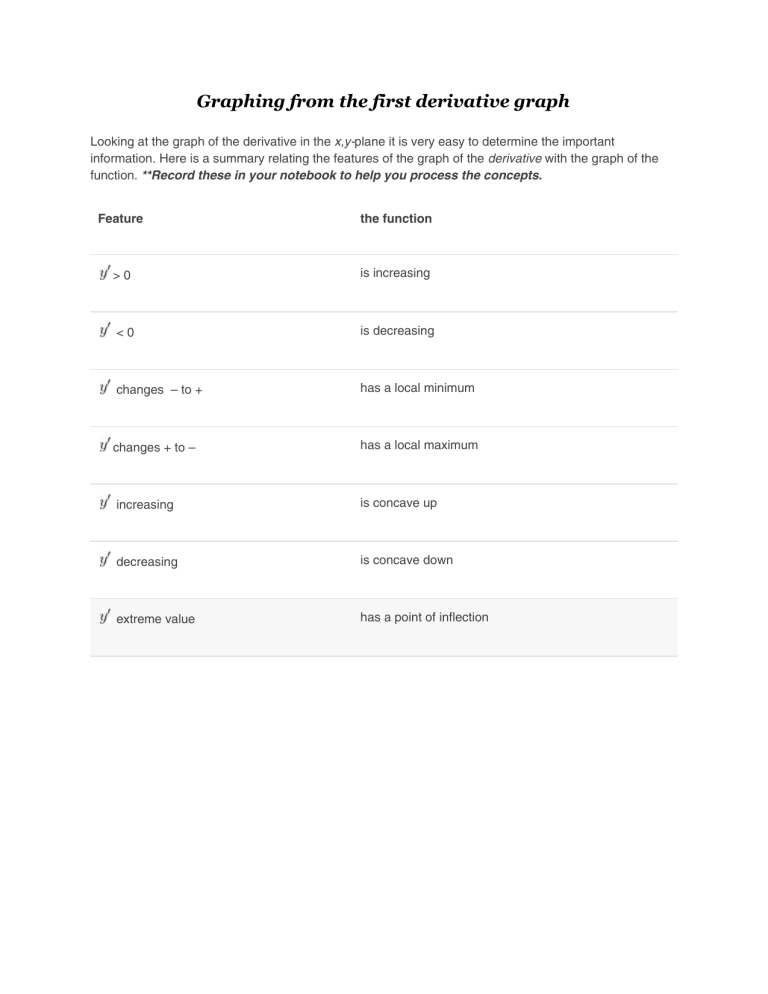
Graphing from the first derivative graph Looking at the graph of the derivative in the x,y-plane it is very easy to determine the important information. Here is a summary relating the features of the graph of the derivative with the graph of the function. **Record these in your notebook to help you process the concepts. Feature the function >0 is increasing <0 is decreasing changes – to + has a local minimum changes + to – has a local maximum increasing is concave up decreasing is concave down extreme value has a point of inflection

