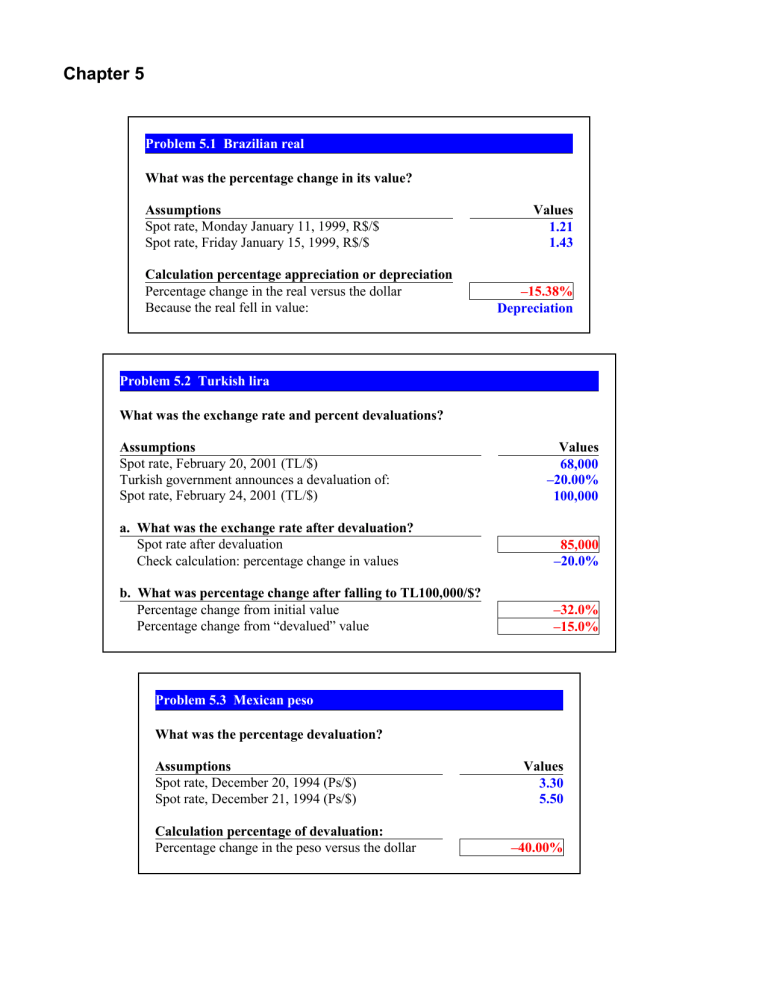
Chapter 5 Problem 5.1 Brazilian real What was the percentage change in its value? Assumptions Spot rate, Monday January 11, 1999, R$/$ Spot rate, Friday January 15, 1999, R$/$ Calculation percentage appreciation or depreciation Percentage change in the real versus the dollar Because the real fell in value: Values 1.21 1.43 –15.38% Depreciation Problem 5.2 Turkish lira What was the exchange rate and percent devaluations? Assumptions Spot rate, February 20, 2001 (TL/$) Turkish government announces a devaluation of: Spot rate, February 24, 2001 (TL/$) Values 68,000 –20.00% 100,000 a. What was the exchange rate after devaluation? Spot rate after devaluation Check calculation: percentage change in values 85,000 –20.0% b. What was percentage change after falling to TL100,000/$? Percentage change from initial value Percentage change from “devalued” value –32.0% –15.0% Problem 5.3 Mexican peso What was the percentage devaluation? Assumptions Spot rate, December 20, 1994 (Ps/$) Spot rate, December 21, 1994 (Ps/$) Calculation percentage of devaluation: Percentage change in the peso versus the dollar Values 3.30 5.50 –40.00% Problem 5.4 Russian ruble What was the percentage devaluation? Assumptions Spot rate, August 7, 1998 (Rub/$) Spot rate, September 10, 1998 (Rub/$) Calculation of percentage change: Percentage change in the ruble versus the dollar Values 6.25 20.00 –68.75% Problem 5.5 Thai baht What was the percentage devaluation? Assumptions Opening spot rate, July 2, 1997 (Bt/$) Closing spot rate, July 2, 1997 (Bt/$) Calculation of percentage change: Percentage change in the baht versus the dollar Values 25.00 29.00 –13.79% Problem 5.6 Ecuadoran sucre What was the percentage change in its value? Assumptions Initial spot rate, 1999 (Sucre/$) Ending spot rate, 1999 (Sucre/$) Calculation of percentage change: Percentage change in the sucre versus the dollar Values 5,000 25,000 –80.00% Problem 5.7 Forecating the Argentine peso What will be the peso’s future value in the coming weeks? Date February 1st (Ps/$) February 28th (Ps/$) Percent change “Eye-balled” Values 2.00 2.20 –9.09% If peso continued to fall at same rate for 1 month: March 1, 2002 (Ps/$) Percent change March 30, 2002 (Ps/$) 2.20 –9.09% 2.42 The period immediately following the peso’s devaluation was highly volatile and a period of transition. Most forecasters would view the February period as a period in which the new exchange rate is beginning to “stabilize” in its trading. Problems 5.8–5.10 Forecasting the Pan-Pacific Pyramid: Australia, Japan & The United States Country Australia Japan United States Country Australia Japan United States Country Australia Japan United States Country Australia Japan United States Gross Domestic Product Industrial Retail Unemployment Forecast Forecast Production Sales Rate Recent Qtr 2003 2004e 2005e Recent Qtr Recent Qtr Recent Qtr 0.9% 2.8% 3.8% 3.1% –0.9% 7.7% 5.5% 6.1% 2.3% 4.1% 2.1% 8.7% -0.5% 4.7% 4.4% 3.2% 4.7% 3.6% 6.3% 8.5% 5.6% Consumer Prices Producer Prices Wages & Earnings Forecast Year Ago 2003 2004e Latest Year Ago Latest Year Ago 3.4% 2.7% 2.3% –1.1% 3.0% 5.1% 4.4% –0.1% –0.3% –0.1% 1.1% –1.1% 0.7% 1.8% 2.1% 2.3% 2.3% 4.9% 2.4% 2.2% 3.0% Money Interest Rates (percent per annum) Supply 3-month money market 2-year 10-year Govt Bonds Corporate Growth Latest Year Ago Govt Bonds Latest Year Ago Bonds 11.0% 5.48% 4.62% 5.18% 5.90% 4.73% 6.66% 2.0% 0.02% 0.01% 0.20% 1.87% 0.63% 1.93% 5.5% 1.40% 0.88% 2.74% 4.70% 3.35% 6.11% Trade Balance Current Account Trade-Weighted Exchange Currency Last 12 mos Last 12 mos Actual 2003 Forecast 04 Rate (1990 100) per Pound (billion $) (billion $) (% of GDP) (% of GDP) June 23 Year Ago June 23 –16.8 –$33.0 –6.2% –5.2% 81.6 83.5 2.65 121.4 $157.2 3.0% 3.3% 136.1 128.5 198 –568.9 –$537.3 –5.0% –5.1% 97.5 101.9 1.82 8. Current spot rates. What are the current spot exchange rates for the following cross rates? a. Japanese yen/US dollar exchange rate (yen/pound spot)/(US$/pound spot) 108.79 b. Japanese yen/Australian dollar exchange rate (yen/pound spot)/(A$/pound spot) 74.72 c. Australian dollar/US dollar exchange rate (A$/pound spot)/(US$/pound spot) 9. Purchasing power parity forecasts. Assuming purchasing power parity, and that the forecast of consumer price increases for the coming year are correct, forecast the: a. Japanese yen/US dollar in 1 year Spot (Y/US$) (1 Y-inflation)/(1 US$-inflation) b. Japanese yen/Australian dollar in 1 Spot (Y/A$) (1 Y-inflation)/(1 A$-inflation) c. Australian dollar/US dollar in 1 year Spot (A$/US$) (1 A$-inflation)/(1 US$ inflation) 10. International Fisher forecasts. Asssuming International Fisher applies to the coming year, forecast the following future spot exchange rates using the 2-year government bond interest rates: a. Japanese yen/US dollar in 1 year Spot (Y/US$) (1 i-2year-Yen)/(1 i-2year-US$) b. Japanese yen/Australian dollar in 1 year Spot (Y/A$) (1 i-2year-Yen)/(1 i-2year-A$) c. Australian dollar/US dollar in 1 year Spot (A$/US$) (1 i-2year-A$)/(1 i-2year-US$) 1.4560 106.24 72.96 1.4560 106.10 71.18 1.4906 Problem 5.11–5.13 Forecasting the Pan-Pacific Pyramid: Australia, Japan & The United States Country Australia Japan United States Recent Qtr 0.9% 6.1% 4.4% Country Australia Japan United States Year Ago 3.4% –0.1% 2.1% Money Supply Growth 11.0% 2.0% 5.5% Trade Balance Country Australia Japan United States Country Australia Japan United States Last 12 mos (billion $) –16.8 121.4 –568.9 Gross Domestic Product Forecast 2003 2004e 2.8% 3.8% 2.3% 4.1% 3.2% 4.7% Consumer Prices Forecast 2003 2004e 2.7% 2.3% –0.3% –0.1% 2.3% 2.3% 3-month money market Latest Year Ago 5.48% 4.62% 0.02% 0.01% 1.40% 0.88% Curent Account Last 12 mos Actual 2003 (billion $) (% of GDP) –$33.0 –6.2% $157.2 3.0% –$537.3 –5.0% Industrial Forecast Production 2005e Recent Qtr 3.1% –0.9% 2.1% 8.7% 3.6% 6.3% Producer Prices Retail Unemployment Sales Rate Recent Qtr Recent Qtr 7.7% 5.5% –0.5% 4.7% 8.5% 5.6% Wages & Earnings Latest Year Ago Latest –1.1% 3.0% 5.1% 1.1% –1.1% 0.7% 4.9% 2.4% 2.2% Interest Rates (percent per annum) 2-year 10-year Govt Bonds Govt Bonds Latest Year Ago 5.18% 5.90% 4.73% 0.20% 1.87% 0.63% 2.74% 4.70% 3.35% Trade-Weighted Exchange Corporate Bonds 6.66% 1.93% 6.11% Currency Rate (1990 100) June 23 Year Ago 81.6 83.5 136.1 128.5 97.5 101.9 per Pound June 23 2.65 198 1.82 Forecast 04 (% of GDP) –5.2% 3.3% –5.1% Year Ago 4.4% 1.8% 3.0% 11. Implied real interest rates. If the nominal interest rate is the 2-year government bond rate, and the consumer price forecast is expected inflation, calculate the following real interest rates: a. Australian dollar real rate forecast for 2003: (1 nominal)/(1 2yr – consumer price change forecast) – 1 2.82% b. Japanese yen real rate forecast for 2003: (1 nominal)/(1 2yr – consumer price change forecast) – 1 0.30% c. US dollar real rate forecast for 2003: (1 nominal)/(1 2yr – consumer price change forecast) – 1 0.43% Note that none of the real interest rates calculated is larger than 1.8%. In the case of Japan, the real interest rate calculated is only as large as it is because of the forecast deflation in the price level (negative change in consumer prices). In the case of the United States, the real rate calculated is actually negative as a result of unusually low nominal interest rates while consumer prices are still seen to be rising over 2% per annum. 12. Forecasting with real interest rates. Using the real interest rates calculated in problem 11, forecast the following future spot exchange rates using real interest rate differentials: a. Japanese yen/US dollar exchange rate in 1 year Spot (Y/US$) (1 Y-real)/(1 US$-real) b. Japanese yen/Australian dollar exchange rate in 1 year Spot (Y/A$) (1 Y-real)/(1 A$-real) c. Australian dollar/US dollar exchange rate in 1 year Spot (A$/US$) (1 A$-real)/(1 US$-real) 108.65 72.89 1.4906 13. Forward rates as forecasts. Calculate the 90-day forward rate on the following currency pairs using the current spot rate and the latest 3-month money market interest rates: a. Japanese yen/US dollar 90-day forward rate Spot (Y/US$) (1 i-3mo-Yen 90/360)/(1 i-3mo-US$ 90/360) 108.42 Spot (Y/A$) (1 i-3mo-Yen 90/360)/(1 i-3mo-A$ 90/360) Spot (A$/US$) (1 i-3mo-A$ 90/360)/(1 i-3mo-US$ 90/360) 73.71 1.4708 b. Japanese yen/Australian dollar 90-day forward rate c. Australian dollar/US dollar 90-day forward rate Problems 5.14–5.15 Forecasting the Pan-Pacific Pyramid: Australia, Japan & The United States Country Australia Japan United States Country Australia Japan United States Country Australia Japan United States Country Australia Japan United States Gross Domestic Product Industrial Retail Unemployment Forecast Forecast Production Sales Rate Recent Qtr 2003 2004e 2005e Recent Qtr Recent Qtr Recent Qtr 0.9% 2.8% 3.8% 3.1% –0.9% 7.7% 5.5% 6.1% 2.3% 4.1% 2.1% 8.7% –0.5% 4.7% 4.4% 3.2% 4.7% 3.6% 6.3% 8.5% 5.6% Consumer Prices Producer Prices Wages & Earnings Forecast Year Ago 2003 2004e Latest Year Ago Latest Year Ago 3.4% 2.7% 2.3% –1.1% 3.0% 5.1% 4.4% –0.1% –0.3% –0.1% 1.1% –1.1% 0.7% 1.8% 2.1% 2.3% 2.3% 4.9% 2.4% 2.2% 3.0% Money Interest Rates (percent per annum) Supply 3-month money market 2-year 10-year Govt Bonds Corporate Growth Latest Year Ago Govt Bonds Latest Year Ago Bonds 11.0% 5.48% 4.62% 5.18% 5.90% 4.73% 6.66% 2.0% 0.02% 0.01% 0.20% 1.87% 0.63% 1.93% 5.5% 1.40% 0.88% 2.74% 4.70% 3.35% 6.11% Trade Balance Current Account Trade-Weighted Exchange Currency Last 12 mos Last 12 mos Actual 2003 Forecast 04 Rate (1990 100) per Pound (billion $) (billion $) (% of GDP) (% of GDP) June 23 Year Ago June 23 –16.8 –$33.0 –6.2% –5.2% 81.6 83.5 2.65 121.4 $157.2 3.0% 3.3% 136.1 128.5 198 –568.9 –$537.3 –5.0% –5.1% 97.5 101.9 1.82 14. Real economic activity and misery. Calculate the country’s Misery Index (unemployment inflation) and then use it like interest differentials to forecast the future spot exchange rate, one year into the future. Australia’s Misery Index Forecast spot Spot ( 1 Misery-1)/( 1 Misery-2) 7.80% Japan’s Misery Index 4.60% United States’s Misery Index 7.90% Starting Spot Rate a. Japanese yen/US dollar exchange rate in 1 year 108.79 b. Japanese yen/Australian dollar exchange rate in 1 year 74.72 c. Australian dollar/US dollar exchange rate in 1 year 1.4560 15. Balance of payments approach. Using the trade and current account information, forecast the direction of the spot exchange rates for the coming year. a. Japanese yen/US dollar exchange rate in 1 year Japan is running a trade & current account surplus US is running a trade & current account deficit Dollar should weaken against the Japanese yen. b. Japanese yen/Australian dollar exchange rate in 1 year Japan is running a trade & current account surplus Australia is running a trade & current account deficit Australian dollar should weaken against the yen. c. Australian dollar/US dollar exchange rate in 1 year Australia is running a trade & current account deficit US is running a trade & current account deficit Indeterminate. Forecast Spot Rate 105.46 72.50 1.45 Problem 5.16–5.17 Forecasting the Pan-Pacific Pyramid: Australia, Japan & The United States © 2004 by Prof. Werner Antweiler, University of British Columbia, Vancouver BC, Canada. Time period shown in diagrams: 1/Jan/1999–7/Sep/2004 16. Current accounts and spot rates. Are the current account forecasts from the previous question consistent with the exchange rate trends shown above? The Japanese yen appreciated in value against the US dollar over most of 2002 and 2003, stabilizing in 2004. This is consistent with the trade and current account balances being run by the two countries. The Australian dollar consistently strengthened against the US dollar over 2002–2003 period. The US dollar recovered some of its lost value in 2004. Although Australia and the United States have similar inflation rate fundamentals, the Australian economy has grown at a more rapid rate in recent years. 17. Exchange rate trends and bounds. Use the graphs to determine trends, mean values, and upper and lower bounds to spot exchange rate movements. Upper Lower Trend Mean Bound Bound Yen/US$ US$ down 110–115 135.00 102.50 A$/US$ US$ down 1.50–1.60 2.00 1.3


