Stock Analysis Report: Returns, Risk, and Portfolio Evaluation
advertisement

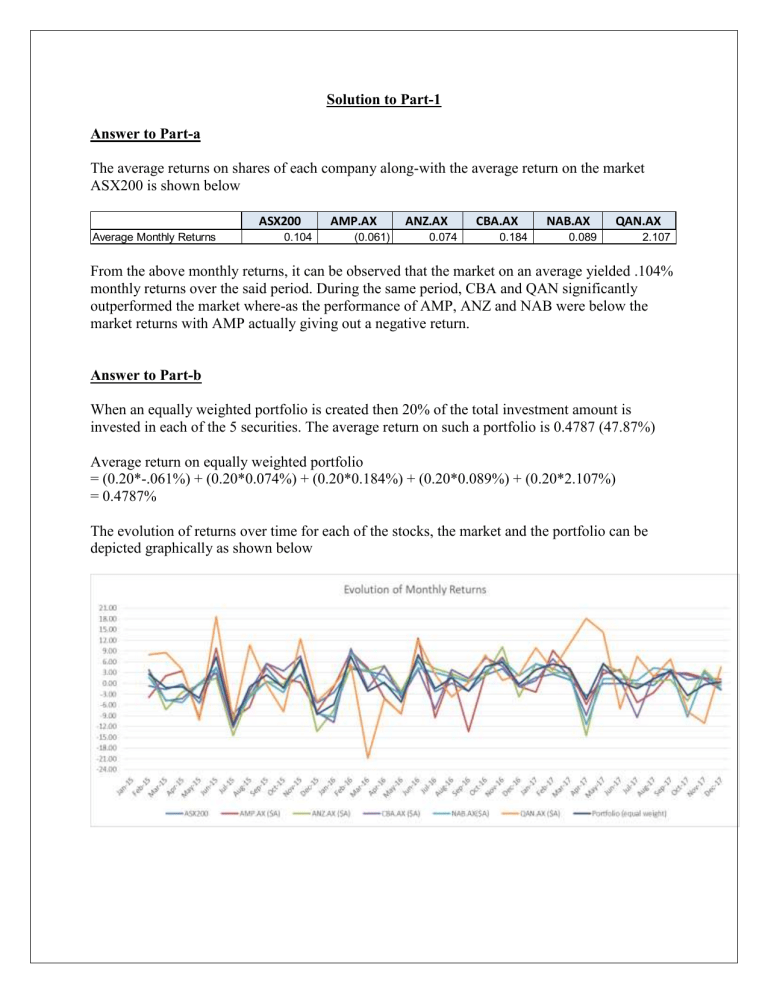
Solution to Part-1 Answer to Part-a The average returns on shares of each company along-with the average return on the market ASX200 is shown below ASX200 Average Monthly Returns 0.104 AMP.AX (0.061) ANZ.AX 0.074 CBA.AX 0.184 NAB.AX QAN.AX 0.089 2.107 From the above monthly returns, it can be observed that the market on an average yielded .104% monthly returns over the said period. During the same period, CBA and QAN significantly outperformed the market where-as the performance of AMP, ANZ and NAB were below the market returns with AMP actually giving out a negative return. Answer to Part-b When an equally weighted portfolio is created then 20% of the total investment amount is invested in each of the 5 securities. The average return on such a portfolio is 0.4787 (47.87%) Average return on equally weighted portfolio = (0.20*-.061%) + (0.20*0.074%) + (0.20*0.184%) + (0.20*0.089%) + (0.20*2.107%) = 0.4787% The evolution of returns over time for each of the stocks, the market and the portfolio can be depicted graphically as shown below Solution to Part-2 Answer to Part-a The standard deviation of returns for each of the five companies is shown below ASX200 Standard Deviation 3.252 AMP.AX 6.315 ANZ.AX 5.869 CBA.AX 5.578 NAB.AX QAN.AX 5.150 9.126 Standard Deviation measures the overall riskiness of a security. From the above standard deviation, it can be seen that out of the 5 stocks analyzed, QAN has the highest associated risk followed by AMP. The riskiness for the all other three stocks are somewhat similar with minor deviations Answer to Part-b The standard deviation of the equally weighted portfolio is 4.614 which is the lowest as compared to the individual standard deviation of each of these 5 shares. This can be attributed to the benefit of diversification which states that a portfolio risk will be somewhat lower than the individual risks. As individual stocks are added to a portfolio the overall riskiness changes depending on the individual riskiness of stocks Answer to Part-c The standard deviation of returns for the market ASX 200 is 3.252 where-as that of the equally weighted portfolio is 4.614. The standard deviation of the market is lower because there are company specific risks which are inherent to each company’s shares in addition to the market risk which influences the risk of individual shares which in turn influences the overall portfolio risk. Generally speaking, portfolio risks or individual stock’s risk will always be greater than that of the market. Solution to Part-3 Answer to Part-a The Beta coefficient of each of the five companies is shown below ASX200 Beta Coefficient 1.000 AMP.AX 0.417 ANZ.AX 0.404 CBA.AX 0.420 NAB.AX 0.441 QAN.AX 0.092 Answer to Part-b Beta coefficient measures the volatility of the stock or the riskiness of the stock relative to the market. The share prices of each company is influenced by host of factors including company specific factors like earnings, announcements, news, events or corporate actions which varies across companies and hence the beta coefficients of each company varies Solution to Part-4 Answer to Part-a INTRODUCTION The monthly stock price movement for the five companies – AMP Ltd., ANZ Bank, Commonwealth Bank of Australia, National Australia Bank and Qantas Airways has been analyzed in order to understand their performance and associated risk for evaluating potential investment options. RETURN EVALUATION The average monthly returns for each of the five companies is shown below which has been calculated using the month end adjusted closing prices from January 2015-December 2017 Out of the five companies analyzed, it can be seen that CBA and QAN has clearly outperformed the market with Qantas Airways being the top performer. The other three firms have yielded a return lower to the overall market with AMP giving out negative returns. RISK ASSESSMENT The associated risks with the share price of each of the five companies can be measures using standard deviation as well as Beta coefficient. The standard deviation and the beta coefficient for the companies analyzed is shown in the snapshot below ASX200 Standard Deviation Beta Coefficient 3.252 1.00 AMP.AX ($A) ANZ.AX ($A) CBA.AX ($A) NAB.AX($A) QAN.AX ($A) 6.315 0.42 5.869 0.40 5.578 0.42 5.150 0.44 9.126 0.09 Risk and Returns always moves in the same direction i.e. higher the risk higher the return because an investor will only invest in a high risk security when the associated return is higher and vice versa. The same can be observed from the risk-return assessment of these five companies – Qantas Airways has the higher associated risk as measured by standard deviation followed by AMP Ltd. However, the market risk as measured by Beta coefficient is the lowest for Qantas where-as it is highest for NAB. The beta coefficient measures the volatility of the stock price and it explains the percentage change in the stock price with 1 unit change in the market index. Overall, Qantas is seen to be the most risky and NAB is the least risky of these five companies. PRICING ANALYSIS In order to analyze the correctness of the prevailing market prices of stocks, it is prudent to analyze the expected and required return of the share prices. The expected and required return for each of the five companies is shown below ASX200 Expected Return Required Return 0.524 0.524 AMP.AX (5.051) 0.292 ANZ.AX 0.872 0.286 CBA.AX (0.354) 0.293 NAB.AX QAN.AX 0.049 0.301 4.841 0.162 As per the general rule of thumb, if the required rate of return is higher than the expected return then the stock is said to be overvalued and if the required rate is lower than the expected return then the shares are under-valued. From the above snapshot, it can be observed that the required return for AMP, CBA and NAB are higher which means that the share prices of these three companies are over-valued where-as the prices of ANZ and QAN are under-valued. CONCLUSION and RECOMMENDATION Based on the risk-return analysis carried out above, it can be concluded that QANTAS and AMP are the riskiest stocks of which AMP has been a clear under-performer over the last two years. Further, the shares of AMP, CBA and NAD are over-valued and does not really qualify a good investment opportunity given it is already highly priced where-as ANZ and QAN are underpriced as well as has performed well over the last two years. In addition, the June 2018 forecast also suggests that ANZ and QAN are expected to yield positive returns. Given the assessment, ANZ and QAN seems to be good investment opportunity from a mediumto-long term perspective and is expected to generated wealth for its investors. However, in order to make an informed investment decision, other factors affecting the company’s performance should also be analyzed and a portfolio evaluation should also be carried out to ensure that risk is getting diversified. Answer to Part-b In order to diversify the overall risk, an equally weighted portfolio can be constructed. The average monthly return of the equally weighted portfolio so created is 0.4787% with a forecast return of 0.07%. Further, the risk as measured by standard deviation for this portfolio is 4.614 with a measured beta of 0.591. Based on this risk-return assessment, it can be concluded that the risk considerably reduces for an equally weighted portfolio with a return which is positive and higher than most of the five companies being analyzed. Thus, keeping in mind the risk-return trade off, it is recommended to invest in an equally weighted portfolio which would help the investor in lowering the risk and generating positive returns.
