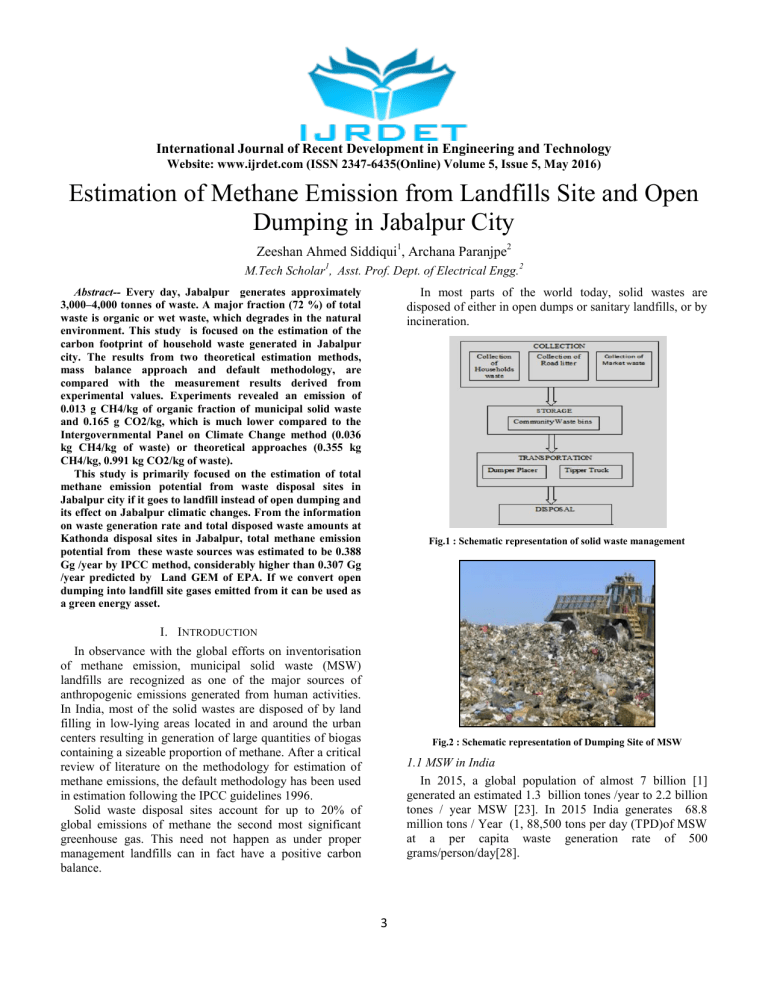
International Journal of Recent Development in Engineering and Technology Website: www.ijrdet.com (ISSN 2347-6435(Online) Volume 5, Issue 5, May 2016) Estimation of Methane Emission from Landfills Site and Open Dumping in Jabalpur City Zeeshan Ahmed Siddiqui1, Archana Paranjpe2 M.Tech Scholar1, Asst. Prof. Dept. of Electrical Engg.2 In most parts of the world today, solid wastes are disposed of either in open dumps or sanitary landfills, or by incineration. Abstract-- Every day, Jabalpur generates approximately 3,000–4,000 tonnes of waste. A major fraction (72 %) of total waste is organic or wet waste, which degrades in the natural environment. This study is focused on the estimation of the carbon footprint of household waste generated in Jabalpur city. The results from two theoretical estimation methods, mass balance approach and default methodology, are compared with the measurement results derived from experimental values. Experiments revealed an emission of 0.013 g CH4/kg of organic fraction of municipal solid waste and 0.165 g CO2/kg, which is much lower compared to the Intergovernmental Panel on Climate Change method (0.036 kg CH4/kg of waste) or theoretical approaches (0.355 kg CH4/kg, 0.991 kg CO2/kg of waste). This study is primarily focused on the estimation of total methane emission potential from waste disposal sites in Jabalpur city if it goes to landfill instead of open dumping and its effect on Jabalpur climatic changes. From the information on waste generation rate and total disposed waste amounts at Kathonda disposal sites in Jabalpur, total methane emission potential from these waste sources was estimated to be 0.388 Gg /year by IPCC method, considerably higher than 0.307 Gg /year predicted by Land GEM of EPA. If we convert open dumping into landfill site gases emitted from it can be used as a green energy asset. Fig.1 : Schematic representation of solid waste management I. INTRODUCTION In observance with the global efforts on inventorisation of methane emission, municipal solid waste (MSW) landfills are recognized as one of the major sources of anthropogenic emissions generated from human activities. In India, most of the solid wastes are disposed of by land filling in low-lying areas located in and around the urban centers resulting in generation of large quantities of biogas containing a sizeable proportion of methane. After a critical review of literature on the methodology for estimation of methane emissions, the default methodology has been used in estimation following the IPCC guidelines 1996. Solid waste disposal sites account for up to 20% of global emissions of methane the second most significant greenhouse gas. This need not happen as under proper management landfills can in fact have a positive carbon balance. Fig.2 : Schematic representation of Dumping Site of MSW 1.1 MSW in India In 2015, a global population of almost 7 billion [1] generated an estimated 1.3 billion tones /year to 2.2 billion tones / year MSW [23]. In 2015 India generates 68.8 million tons / Year (1, 88,500 tons per day (TPD)of MSW at a per capita waste generation rate of 500 grams/person/day[28]. 3 International Journal of Recent Development in Engineering and Technology Website: www.ijrdet.com (ISSN 2347-6435(Online) Volume 5, Issue 5, May 2016) Solid waste generation is a natural phenomenon of human life [1]. The current municipal solid waste management system has different alternative as reported earlier. The material recovery facility is being the most prominent method among other methods such as source reduction, reuse, recycling, composting, incineration, energy recovery, on-site burial, open burning and bioremediation, as it reduces the amount of fresh raw material resources for production [2]. 1.5 Material and methods In this chapter, different techniques adopted for the estimation of CF are compared along with field experiments to assess the validity of theoretical estimates. There are a number of methods to estimate the carbon footprint in terms of methane emissions from solid waste disposal methods. These methods are broadly classified into 1. Theoretical estimations method 2. Experimental estimations method 1.2 Total Potential of MSW in Jabalpur City Jabalpur is one of the four major cities in Madhya Pradesh (India) with a population of approximately above 24 lacks produces 1, 59,826 tons per annum and 450 tons per day of MSW. This waste is disposed by open dumping site at the Ranital dumping site MSW problem is a major concern in major cities Jabalpur. The organic fraction of solid waste composition comprised about 71%. The waste generation rate has increased from 0.23kg/capita/day in 2004-05 to 0.50 kg/capita/day (500 g/c/d) in 2015 indicating an increase rate of 3.8% per year. MSW is the waste generated in a community with the exception of industrial and agricultural wastes. Hence MSW includes residential waste (e.g., households), commercial (e.g., from stores, markets, shops, hotels etc), and institutional waste (e.g., schools, hospitals etc). Paper, paperboard, garden and food waste can be classified in a broad category known as organic or biodegradable waste [3] Fig. 3 Flow chart of experimental setup 1.6 In the aerobic condition Gas analysis by Weight Reduction method In the experimental setup A2 model the model filled with sample of MSW and weighed and after 10, 20 and 30 days again weighed then find out the difference of weight first day and 30 days is the measurement of CO2 gas. We find the subsequent reductions in the total waste quantity kept on day 0. 1.3 Waste Generation Details - Sources (Present) Per Capita waste produced : 500 gm/capita/day Total waste produced : 427 T/day Quantity of waste to be collected & transported to Kathonda SLF will be round 320 T/day (Collection & Removal Efficiency of 75%) . II. ANALYSIS O F COMPOSTING P ROCESS Composting is an aerobic process of organic waste treatment. During the composting process, waste gets converted into compost or manure. Particularly, the carbon content of waste gets converted to humus or emitted into the environment as carbon dioxide. 1.4 Waste Characteristics in Jabalpur Compostable Material – 40 – 45 % Paper & Card board – 5 – 15 % Plastic – 2 – 8 % Inert Material – 5 – 15 % Metal – 1 -2 % Calorific value LCV(Kcal/kg) Residential areas 1500-1600 Fruit & Vegetables market C/N Ratio 20 : 36 Moisture content 20 to 58% S.NO. Process 1 Anaerobic Digestion Aerobic digestion 2 4 No. of days 30 days 30 days Model Waste quantity sample A1 200 gms MSW A2 200gms MSW International Journal of Recent Development in Engineering and Technology Website: www.ijrdet.com (ISSN 2347-6435(Online) Volume 5, Issue 5, May 2016) MSWT = Per day generation in Jabalpur city = 450 tons / day MSWF = Collection of disposal site 70% of total MSW per day = 450 x 70/100 = 315 tons/day MCF = 0.4 Per cent DOC (by weight) = 0.4 (A) + 0.17 (B) + 0.15 (C) + 0.30 (D) A=paper + rags = 4.18 + 22.14 = 26.32 % B=leaves +hay +straw = 23+ 13.9 = 36.9 % C=fruits and vegetables = 60.34 % D=wood = 1 % Sample calculation = 0.4 x 26.32 + 0.17 x 36.9 +0.15 x 60.34+ 0.3 x 1 = 10.53 + 6.28 + 9.05 + 0.3 = 26.16 % = 0.261 DOCF = 0.014T+ 0.28 = 0.77 At T= 35oC F = 0.5 R= 0 OX= 0 CH4 = 450 X 315 X 0.261 X 0.4 X 0.77 X 0.5 X (16/12 – 0) X (1- 0) 7.577 Gg/y = 7,577.67 tons/y = .0075 kg/d= .0075/.315 = .023 kg/kg Photograph1: Experimental setup 1 In the estimation of methane emission potential by the IPCC default method, the amount of solid waste that is available for anaerobic degradation and methane generation was assumed as 100 %. The result shows that there was about 20.76 tpd. Photograph2: Experimental setup 2. III. METHODOLOGY 3.1 Determination of Emissions by Mass Balance Approach The elemental composition of the sample was found to be comparable with the literature. According to Reinhart (2004), the elemental composition of sample was 1.30, 0.07, and 0.17 of carbon, nitrogen, and hydrogen, respectively. From stoichiometric calculations it can be seen that 1.1978 mol of methane and 1.2143 mol of carbon dioxide is emitted from 1 mol of analyzed sample (C2.98H0.462O1.02N0.099) under anaerobic conditions. Thus, 0.355 kg of CH4 and 0.991 kg of CO2 are emitted from 1 kg of waste sample. Similarly, under aerobic conditions, carbon dioxide emissions were found to be about 2.431 kg/kg of waste. Therefore, the total emissions from Jabalpur city solid waste using mass balance approach in anaerobic conditions is 111.825 tpd of methane and 312.165 tpd of carbon dioxide. Methane gas analysis by IPCC Default estimation method The default method is recommended by the IPCC for the estimation of Jabalpur city and regional emissions. For inventory estimation The Revised IPCC (1996) Guidelines for National GHG Inventories outline two methods to estimate methane emissions from solid waste disposal sites: the default method. 5 International Journal of Recent Development in Engineering and Technology Website: www.ijrdet.com (ISSN 2347-6435(Online) Volume 5, Issue 5, May 2016) 3.2 Gas analysis through Experimental model Methane and carbon dioxide are measured and quantified at the laboratory scale through waste degradation under aerobic and anaerobic conditions. This process involves design of a model, monitoring, and quantification of emissions. Total daily emissions from the organic fraction of solid waste degradation in Jabalpur are (450t/d, 70% at the dumping site 45% organic waste = 141.75 kg) 8.93 gms and 14.33 gms of methane and carbon dioxide, respectively total (23.26 gms). In aerobic condition total emission daily 11396.7 gms /day (11.39 kg/d). 3.3 Weight Reduction analysis In experimental setup A1and A2 samples were weighed on a balance on days 0, 5, 10, 15, 20, 25 and 30 to check subsequent reductions in the total waste quantity kept on day 0. The early pH of 5.3 in waste samples suggests the beginning of degradation. Fresh organic fractions of MSW will have pH in range of 6–7. The initial temperature was 27oC and during the degradation; the temperature in the anaerobic setup was 25–26oC in all samples. Anaerobic digestion occurs under two temperature regimes: mesophilic (between 20 and 45oC, usually 35 oC) and thermophilic (between 50 and 75oC, usually 55oC). At the experimental scale, total wet waste reduction in anaerobic degradation was found to be faster than aerobic degradation. IV. COMPARISON O F EMISSIONS COMPUTED USING D IFFERENT METHODS O F ESTIMATION 7.3.1 Determination of Emissions by Mass Balance Approach The elemental composition of the sample was found to be comparable with the literature. According to Reinhart (2004), the elemental composition of sample was 1.30, 0.07, and 0.17 of carbon, nitrogen, and hydrogen, respectively. From stoichiometric calculations it can be seen that 1.1978 mol of methane and 1.2143 mol of carbon dioxide is emitted from 1 mol of analysed sample (C2.98H0.462O1.02N0.099) under anaerobic conditions. Thus, 0.355 kg of CH4 and 0.991 kg of CO2 are emitted from 1 kg of waste sample. 4.1 Default Methodology In the estimation of methane emission potential by the IPCC default method, the amount of solid waste that is available for anaerobic degradation and methane generation was assumed as 100 %. The result shows that there was about 20.76tpd, 7,577.67 tons/y, 0 .0075 kg/d (0075/.315 = .023 kg/kg), methane potential for the city, which is less than estimated emission from the mass balance approach. If we compare methane emission from each kilogram of organic waste, then through this method estimated methane emission will be 0.023 kg/kg of waste. Table 7 Emission from Anaerobic/ Aerobic degradation of waste (in 30 days) Mo del Waste quantity Total CH4 CO2 Other gases A1 200gms 29.7 ml 17.7 ml 88.5 ml 0.063 g/kg 10.3 ml 51.5 ml 0.101 1g/kg 16.14 gms 80.4 g/kg 1.7 ml 1 kg 1 g/kg A2 200 gms 1 kg 148.5 ml 8.5 ml 4.2 Experimental Estimation Method In contrast to the theoretical estimation method, in which methane emission potential is calculated based on the amount of waste being disposed every day, the theoretical methods overestimate emission values, necessitating quantification of methane emission at the laboratory scale. Total methane emission from Jabalpur city solid waste using the experimental emission factor is 8.93 gms/day (.008 kg/d) and carbon dioxide is 14.33 gms /day (.0143 kg/d). Results are much lower than theoretically estimated values because these methods assume that all potential methane is released as it comes in contact with the environment. Landfills with mature waste enhance the methane emissions from fresh waste under anaerobic conditions. Table -- shows a comparison of emission factors computed by different methodologies. 7.2 Emission Factor (Based on the Experiment) The emission factors for gaseous emissions of methane and carbon dioxide were 0.063 gm/kg and 0.1011gm/kg, respectively Gas volume convert to ml to gm (CH 4 = 88.5 x 0.716 = 0.063 g/kg, CO2 = 51.5 x 1.965 = 0.1011 g/kg). (Because gaseous volume was in milliliter, it was converted into gaseous mass using gas volume and the respective density at standard temperature and pressure: Density= Mass/Volume, with the density of methane and carbon dioxide as 0.716 and 1.965 g/l, respectively.) 6 International Journal of Recent Development in Engineering and Technology Website: www.ijrdet.com (ISSN 2347-6435(Online) Volume 5, Issue 5, May 2016) Table 8 Comparison of emission factors Reduction of waste generation is possible through reduced waste generation, segregation at source level, reuse, and recovery of waste. Composting and anaerobic digestion are treatment options for organic waste (which constitute 70–75 % of the total), whereas recycling is used for inorganic materials (15–18 %). Wastes that cannot be treated or recycled are ultimately disposed at disposal sites or landfills. Segregation at the source with treatment at local levels (ward levels) plays a prominent role in minimizing organic fractions getting into disposal site. GHG emission factors vary with methodology. Experiments conducted reveal an emission of 0.013 gm of CH4/kg of organic fraction of municipal solid waste and 0.165 gm CO2/kg, which is much lower compared to the IPCC method (0.036 kg CH4/kg of waste) or theoretical approaches (0.355 kg CH4/kg, 0.991 kg CO2/kg of waste). The current work provides emission factors at local levels, which could help in the accurate quantifications of emissions. Note : default method of IPCC accounts for only CH4 Comparision of Emission using different Methods of estimation 1400 Emission in Gms/kg 1200 1000 800 Problems: - No cooperation between public, households, traders, officials, etc. because of a lack of awareness and remote habits. - Not enough tools, machines, vehicles, - Insufficient manpower - Insufficient workshop facility - Insufficient funds - Unskilled supervisors - Lack of infrastructural designing of roads, drains, squares, public utility places - Encroachments, irregular traffic, advanced use of packing material, plastic, etc. 600 400 200 0 MBA DM AN A Different methods of emission Emissions in gms/Kg 12000 Emission in gms/Kg 10000 8000 6000 4000 Resulting difficulties: - Health risks to workers - Breeding of rodents, flies, etc. - Ugliness of streets - Air pollution - Surface and groundwater pollution - Danger of heavy metal concentration especially found in the food chain when liquid hazardous waste is mixed in drains. The uncontrolled land disposal of MSW results in ground water pollution and creates unhygienic situation in the surroundings or nearby habitats. Foul smell, rodents, flies, stray animals are often attracted by such haphazard dumping of MSW. Methane (CH4) gas is the most hidden nuisance parameter emerged out of such land disposal. Generally, emission of methane gas is not noticed, which is responsible for health as well as fire hazard. 2000 0 Emission through Land ]fills Emission through the Open dumping Emission of MSW V. CONCLUSIONS The direct or indirect emissions of carbon dioxide, methane, and other GHGs, expressed in terms of carbon dioxide equivalents, indicate the CF of a region, which constitutes a vital environmental indicator to mitigate global warming and consequent changes in the climate. This study indicated that the theoretical estimation of emissions from solid waste is much higher than the experimentally Carbon Footprint of Solid Waste Sector 289 determined value. Total emissions from ward-wise waste of the city are 19.13 and 242.83 kg/day of methane and carbon dioxide, respectively. 7 International Journal of Recent Development in Engineering and Technology Website: www.ijrdet.com (ISSN 2347-6435(Online) Volume 5, Issue 5, May 2016) It is also identified as an important ingredient of green house gases (GHG) responsible for global warming. According to Intergovernmental Panel on climate change (IPCC) , landfill accounts for about 30 % of methane emission to the atmosphere. Landfill ranks the fourth largest source for emission of methane gas. The European Union (EU) has formulated a policy for 50 % to reduction of landfill gases (LFG) emission by the year 2020. Out of 6000 landfills in US, over 2,500 are operational as per EPA guidelines. In India and other developing countries, uncontrolled open dumping is a common practice which has been identified as source of methane gas generation . In absence of gas recovery provisions , the atmosphere is likely to be overburden with this green house gas (Methane) . Therefore , an attempt has been made for assessment of landfill gases considering various factors in Indian conditions. The rate of increase of MSW generated per capita is estimated at 1 to 1.33% annually. The per capita generation rate of MSW in India ranges from 0.2 to 0.5 kg/ day. Projected MSW quantities are expected to increase from 34 million tonnes in 2000 to 83.8 million tonnes in 2015 and 221 million tonnes in 2030.Out of solid waste generated in million cities, hardly 30% is treated before disposal. These facts necessitate the pressing need to develop MSW facilities across the country. The landfill operation normally varied widely from the minimum requirement of having only daily cover and waste compaction to fully equipped sanitary landfill with standard liner, cover soil, leachate collection/treatment system, gas collection and ventilation system and groundwater monitoring wells. 6.2 Determination of Total Methane Emission Potential by IPCC Method In the estimation of methane emission potential from waste disposal sites in Indore by IPCC default method, the fraction of biodegradable organic carbon and biodegradable organic carbon that is readily available for degradation was set at 0.5 and 0.25 Gg C/Gg waste. Methane content in landfill gas was assumed at 0.5 fractions. These figures were the typical values for municipal solid wastes characteristic. The fraction of methane gas that is oxidized to carbon dioxide was not taken into account, or in other words OX was assumed to be 0. The estimation of methane emissions from landfills through the FOD equation suggested as a first order reaction rate as k=0.02 or a half life about 35 years are associated with dry and slowly degradable waste such as wood or paper. It is comparatively lower than k=0.2 or half life of about 3 years for high moisture and rapidly degradable waste such as food waste. The amount of solid wastes that is available for anaerobic degradation and methane generation was assumed 50% of the total waste amount for landfill. The results show that there was about 0.388 Gg/year of methane emission potential in those sites in the Year 2012. VI. RESULT AND D ISCUSSION 6.1 Description of Indore Municipal Solid Waste A survey of waste disposal site in Indore Presently, the city generates about 908 Ton/day of Municipal Solid Waste (MSW) [4]. All the stages of SWM (Solid Waste Management) are collected for transportation and disposal of refuse. Presently, the IMC (Indore Municipal Corporation) only removes about 70% of generated solid waste from the city. The waste is crudely dumped on the Devguradia trenching ground, about 12 km away from the city, which has an inadequate approach road. Through a questionnaire and field visits revealed that in the year 2011, there were currently 69 wards in the city they were generated 478.702 Ton/day of waste from which 335.939 tons/day were collected for disposal at 71.1% collection efficiency [5]. The remainder was disposed of in abandoned land, which is not identified as waste disposal site. Two major methods are being employed for the disposal of wastes in these sites, i.e. landfill and open dumping. REFERENCES [1] [2] [3] [4] [5] 8 U.S. census Bureau, 2011. Hegde, U., Chang, T.C., Yang, S.S., 2003. Methane and carbon dioxide emissions from Shan- chu-ku landfill site in northern Taiwan. Chemosphere 52, 1275–1285. National Environmental Engineering Research Institute, NEERI. Air Quality Assessment, Emissions Inventory and Source Apportionment Studies: Mumbai. New Delhi : Central Pollution Control Board (CPCB), 2014-15. Ying-Chu Chen, Shang-Lien Lo,”Evaluation of greenhouse gas emissions for several municipal solid waste management strategies”, Journal pf cleaner Production , volume 113, 1 February 2016, Pages 606-612. Stphanic C. Bolyard, Debra R. Reinhart,”Application of landfill treatment approaches for stabilization of municipal solid waste” Available online 1 February 2016.


