Venn Diagrams & Probability Worksheet
advertisement

FLUENCY HOMEWORK
VENN DIAGRAMS AND PROBABILITY
NON-CALCULATOR
You must show your calculations
Q1. Draw a Venn diagram to show the following sets.
• ξ = {1,2,3,4,5,6,7,8,9,10,11,12,13,14,15}
• M = {1,2,3,5,6,15}
• N = {1,2,4,5,8,10}
• P = {1,2,4,7,14,}
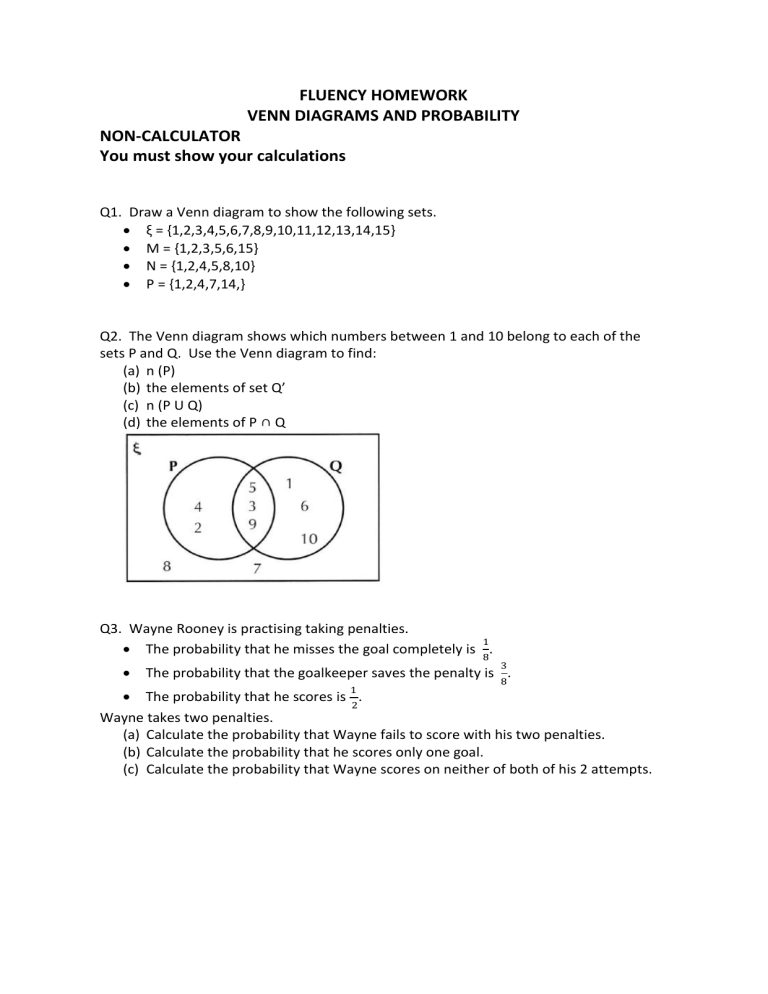
Q2. The Venn diagram shows which numbers between 1 and 10 belong to each of the
sets P and Q. Use the Venn diagram to find:
(a) n (P)
(b) the elements of set Q’
(c) n (P U Q)
(d) the elements of P ∩ Q
Q3. Wayne Rooney is practising taking penalties.
1
• The probability that he misses the goal completely is 8.
•
3
The probability that the goalkeeper saves the penalty is 8.
1
• The probability that he scores is 2.
Wayne takes two penalties.
(a) Calculate the probability that Wayne fails to score with his two penalties.
(b) Calculate the probability that he scores only one goal.
(c) Calculate the probability that Wayne scores on neither of both of his 2 attempts.


