Halloween Treat Bag Graphing Worksheet
advertisement
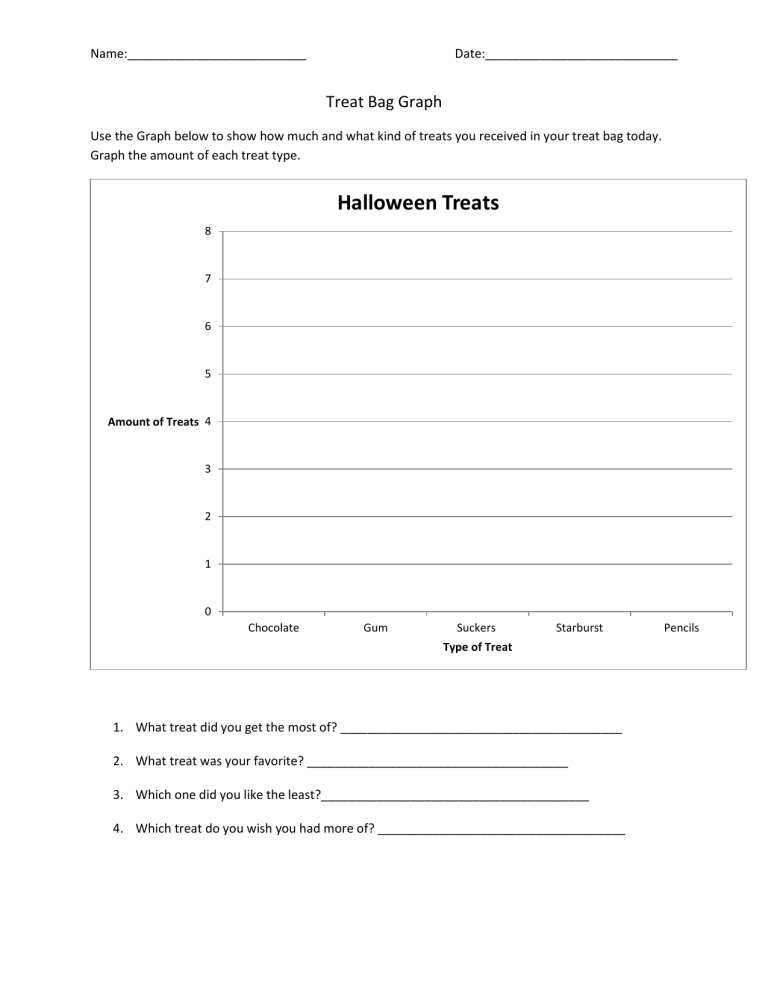
Name:__________________________ Date:____________________________ Treat Bag Graph Use the Graph below to show how much and what kind of treats you received in your treat bag today. Graph the amount of each treat type. Halloween Treats 8 7 6 5 Amount of Treats 4 3 2 1 0 Chocolate Gum Suckers Starburst Type of Treat 1. What treat did you get the most of? _________________________________________ 2. What treat was your favorite? ______________________________________ 3. Which one did you like the least?_______________________________________ 4. Which treat do you wish you had more of? ____________________________________ Pencils
