Exponential and Logarithmic Models
advertisement
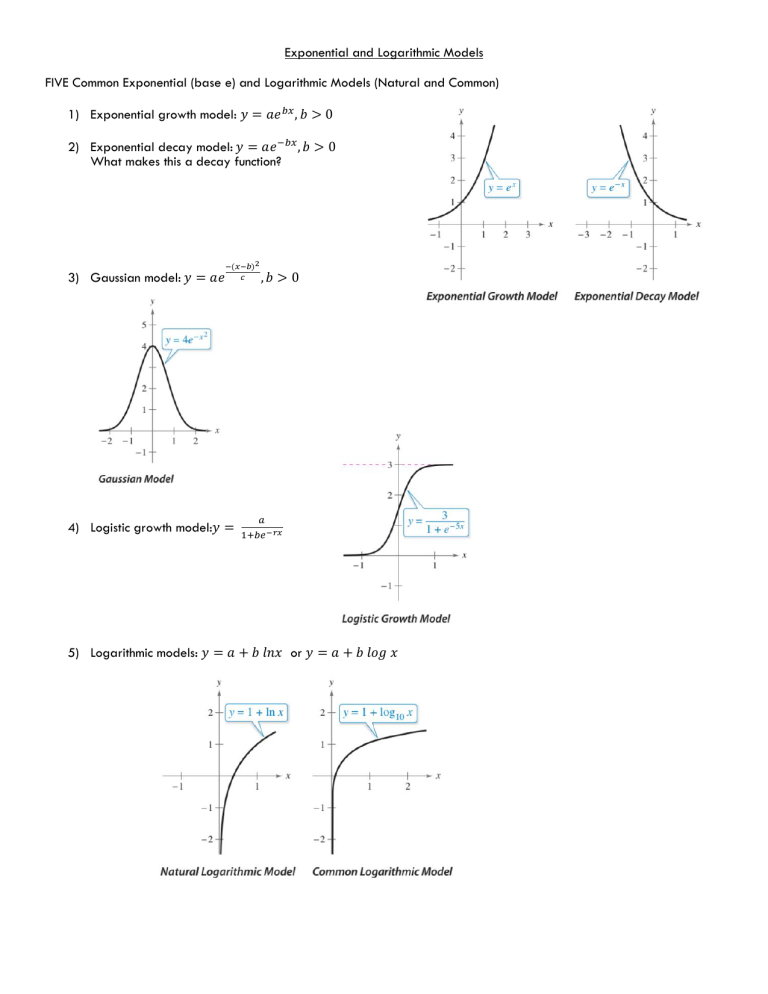
Exponential and Logarithmic Models FIVE Common Exponential (base e) and Logarithmic Models (Natural and Common) 1) Exponential growth model: 𝑦 = 𝑎𝑒 𝑏𝑥 , 𝑏 > 0 2) Exponential decay model: 𝑦 = 𝑎𝑒 −𝑏𝑥 , 𝑏 > 0 What makes this a decay function? 3) Gaussian model: 𝑦 = 𝑎𝑒 −(𝑥−𝑏)2 𝑐 4) Logistic growth model:𝑦 = ,𝑏 > 0 𝑎 1+𝑏𝑒 −𝑟𝑥 5) Logarithmic models: 𝑦 = 𝑎 + 𝑏 𝑙𝑛𝑥 or 𝑦 = 𝑎 + 𝑏 𝑙𝑜𝑔 𝑥 Previously learned models: What do all the variables mean? 1) 𝑦 = 𝑎 ∙ 𝑏 𝑥 General Exponential Function 2) 𝑦 = 𝑎(1 + 𝑟)𝑡 Exponential Growth 3) 𝑦 = 𝑎(1 − 𝑟)𝑡 Exponential Decay 𝑟 𝑛𝑡 4) 𝑦 = 𝑎 (1 + 𝑛) Compounding Interest “n” times 5) 𝑦 = 𝑃𝑒 𝑟𝑡 Continuously Compounding Interest EXAMPLE #1: Estimates of the world population (in millions) from 2003 to 2009 are shown in the table. An exponential growth model that approximates these data are given by 𝑃 = 6097𝑒 0.0116𝑡 Where P is the population (in millions) and t= 3 represents 2003. Compare the values given by the model with the estimates shown in the table. According to this model, when will the world population be 7.8 billion? EXAMPLE #2: In living organic material, the ratio of the content of radioactive carbon isotopes (carbon 14) to the content of nonradioactive carbon isotopes (carbon 12) is about 1 to 1012. When organic material dies, its carbon 12 content remains fixed, whereas the carbon 14 begins to decay with a half-life of 5700 years. To estimate the age of dead organic material, scientists use the following formula which denotes the ratio of carbon 14 to carbon 12 present at any time 𝑡 (in years). 𝑅= 1 −𝑡 𝑒 8223 12 10 The ratio of carbon 14 to carbon 12 in a newly discovered fossil is 𝑅 = 1 1013 Estimate the age of the fossil. EXAMPLE #3: Gaussian Model This type of model is commonly used in statistics to represent populations that are normally distributed. The graph of a Gaussian model is called a bell-shaped curve. The average value for a population can be found from the bell-shaped curve by observing where the maximum y-value of the function occurs. The x-value corresponding to the maximum y-value of the function represents the average value of the independent variable – in this case, x. SAT SCORES In 2013, the SAT math scores for college bound seniors roughly followed the normal distribution 𝑦= −(𝑥−514)2 0.0034𝑒 27848 , 200 ≤ 𝑥 ≤ 800 Use your graphing calculator to find the average SAT math score for 2013. An average for a Gaussian Model is the “vertex” of the bell curve. EXAMPLE #4 Logistic Growth Models Some populations initially have rapid growth, followed by a declining rate of growth, as indicated by the graph. One model for describing this type of growth pattern is the logistic curve given by the function: 𝑦= 𝑎 1 + 𝑏𝑒 −𝑟𝑥 Where y is the population size and x is time. An example is a bacteria culture that is initially allowed to grow under ideal conditions, and then under less favorable conditions that inhibit growth. A logistic curve is also called a sigmoidal curve. SPREAD OF A VIRUS On a college campus of 5000 students, one student returns from vacation with a contagious flu virus. The spread of the virus is modeled by 𝑦= 5000 ,𝑡 ≥ 0 1 + 4999𝑒 −0.8𝑡 Where y is the total number of students infected after t days. The college will cancel all classes when 40% or more of the students are infected. a. How many students are infected after 5 days? b. After how many days will the college cancel classes? EXAMPLE #5: Logarithmic Models On the Richter scale, the magnitude R of an earthquake of intensity I is given by 𝑅 = log10 𝐼 𝐼0 where 𝐼0 = 1 is the minimum intensity used for comparison. Intensity is a measure of the wave energy of an earthquake. In 2001, the coast of Peru experienced an earthquake that measured 8.4 (magnitude) on the Richter scale. In 2003, Colima, Mexico experienced an earthquake that measured 7.6 (magnitude). Find the intensity of each and compare. MODELING DATA PRACTICE: A new 2016 Tesla S that sold for $68,000 now has a 2018 KBB book value of $50,480. 1) Find a linear model for the value of the Tesla S. What does the equation mean in the context of the situation? 2) Find an exponential model for the value of the Tesla S. Round the numbers in the model to 4 decimal places. What does the equation mean in the context of the situation? 3) Which model represents a greater depreciation rate? 4) For what years is the value of the Tesla S greater using the linear model? The exponential model?
