Solutions
advertisement

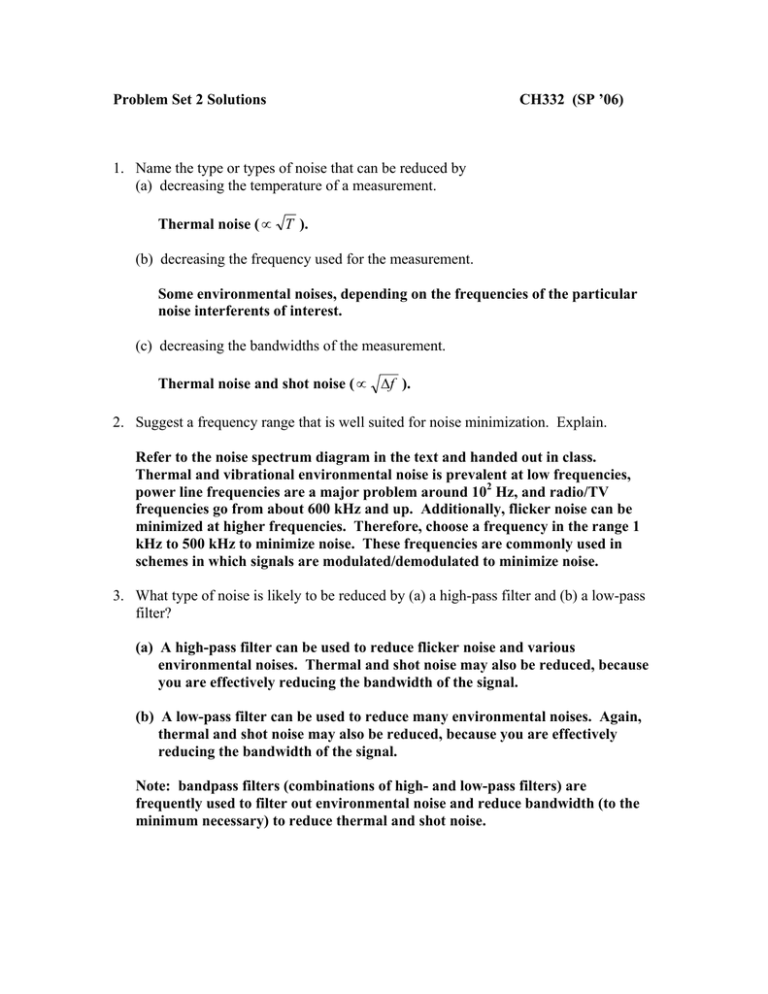
Problem Set 2 Solutions CH332 (SP ’06) 1. Name the type or types of noise that can be reduced by (a) decreasing the temperature of a measurement. Thermal noise ( ∝ T ). (b) decreasing the frequency used for the measurement. Some environmental noises, depending on the frequencies of the particular noise interferents of interest. (c) decreasing the bandwidths of the measurement. Thermal noise and shot noise ( ∝ ∆f ). 2. Suggest a frequency range that is well suited for noise minimization. Explain. Refer to the noise spectrum diagram in the text and handed out in class. Thermal and vibrational environmental noise is prevalent at low frequencies, power line frequencies are a major problem around 102 Hz, and radio/TV frequencies go from about 600 kHz and up. Additionally, flicker noise can be minimized at higher frequencies. Therefore, choose a frequency in the range 1 kHz to 500 kHz to minimize noise. These frequencies are commonly used in schemes in which signals are modulated/demodulated to minimize noise. 3. What type of noise is likely to be reduced by (a) a high-pass filter and (b) a low-pass filter? (a) A high-pass filter can be used to reduce flicker noise and various environmental noises. Thermal and shot noise may also be reduced, because you are effectively reducing the bandwidth of the signal. (b) A low-pass filter can be used to reduce many environmental noises. Again, thermal and shot noise may also be reduced, because you are effectively reducing the bandwidth of the signal. Note: bandpass filters (combinations of high- and low-pass filters) are frequently used to filter out environmental noise and reduce bandwidth (to the minimum necessary) to reduce thermal and shot noise. 4. In which of the following measurements has the detection limit been reached? Measurement A B Use the equation Analyte Signal Blank Signal 1.52 ± 0.05 0.94 ± 0.03 1.38 ± 0.07 0.81 ± 0.02 S sample = S blank + ksblank where the detection limit has been reached if k ≤ 3 and s blank is the standard deviation of the blank. For Measurement A: 1.52 = 1.38 + k 0.07 k =2<3 For Measurement B: 0.94 = 0.81 + k 0.02 k = 6 .5 > 3 So, the detection limit has been reached for Measurement A, but not for B. 5. a) Make the necessary conversions in order to fill in the table: b) Name the region of the electromagnetic spectrum associated with each of the five columns. 420 1x10⁶ 5.9x10³ 2.4x10³ 3.65x10⁴ Wavenumber (cm-1) 2.4x10⁵ 100 1.7x10⁴ 4.1x10⁴ 2.74x10³ Energy (J) 4.7x10⁻¹⁸ 2x10-21 3.4x10⁻¹⁹ 8.1x10⁻¹⁹ 5.44x10⁻²⁰ 30 1x10⁻² 2.1 5.1 3.40x10⁻¹ Energy (kJ/mol) 2.8x10³ 1 200 490 32.8 Frequency (Hz) 7.1x10¹⁵ 3x10¹² 5.1x10¹⁴ 1.2x10¹⁵ 8.21 x 10¹³ Spectral region Far UV Far IR Visible(green) Near UV Mid IR Wavelength (Å) Energy (eV) 6. A 100 W tungsten filament lamp operates at a temperature of 2000 K. Assuming that the filament emits like a blackbody, what is the total power emitted between 600.0 and 600.1 nm? How many photons per second are emitted in this wavelength interval? Use the Planck equation ρν = 8πhν 3 c3 1 ν h kT −1 e c In fact we will use Iν = ρν , since we are looking for power emitted. The 4 total power per unit area over the range 600 nm (ν1=4.9965 x 10¹⁴) and 600.1nm (ν2=4.9957 x 10¹⁴) is given by the integral ν2 I = ∫ I ν dν ν1 This is an integral of a complicated function that is not easily converted to an analytical expression. Either we can do the integral explicitly with mathematical software (e.g., Mathematica), or we can approximate the integral (since ∆ν << ν) by: ν2 I = ∫ Iν dν ≅ I v (v)∆ν ν1 where I v (v ) is I v evaluated at the frequency ν (choose ν as one or other of the endpoints or perhaps better as the average frequency; it doesn’t much matter, since ∆ν << ν). So, we have I ≅ I v (v) ∆ν = 5.457 Jm −2 s −1 We can divide by the energy of a single photon to find the number of photons per second per unit area. N photons A = 5.457 −2 −1 m s = 1.744 × 10¹⁹ m −2 s −1 hν But we wanted total number of photons per second, not photons per unit area. How to get around this? Find the effective surface area of the filament. We are given the additional information that the total output power of the filament is 100 W. So, the output integrated over the entire spectrum (units of J m-2 s-1), multiplied by the filament surface area A, must equal 100 W. ∞ 100W = ∫ Iν dν × A 0 The approximation to the integral used earlier does not hold here, since ∆ν = ∞ >> I v , so we must do this integral explicitly (use Mathematica). Solving for the surface area ∞ A = 100W / ∫ Iν dν = 9.303 × 10 −5 m 2 0 Now going back to the number of photons over the small range we are interested in, we have our answer: N photons = 1.744 × 10¹⁹ m −2 s −1 × 9.303 × 10 −5 m 2 = 1.623 × 10¹⁵ s −1 7. For a 1 mW Helium-Neon laser with a beam diameter of 1 mm: a) How many photons per second are emitted at 632.8 nm? We are already given the power. Divide by the photon energy to find photons per second. N photons = 1mW = 3.371 × 10¹⁵ s −1 hν b) If the laser linewidth is 1 kHz, what temperature would a blackbody source have to be to emit the same number of photons from an equal area over the same frequency interval as the laser? This problem is similar to the Problem 6, except here we want to work back to photons per unit area. Divide Nphotons from above by the area of the laser spot to find photons per second per unit area. The area of the beam spot is A = πr 2 = π (10 −3 m / 2) 2 = 7.854 × 10 −7 m 2 N photons A 3.371 × 10¹⁵ s −1 = = 4.292 × 10 21 m −2 s −1 −7 2 7.854 × 10 m We want to equate this to the output of a blackbody source over the same frequency range. As before, the power output of a blackbody per unit area is ν2 I = ∫ Iν dν ≅ I v (v)∆ν ν1 Again, for simplicity, let’s take advantage of the approximation to the integral (since ∆ν << ν). Divide by the photon energy. Then the number of photons per area per second (which we have from above) is N photons A = I (v) ∆ν I v (v) × 1000 Hz I = v = = 4.292 × 10 21 m −2 s −1 hν hν hν Now we have 2πhν 3 I v (v) = 1.273m s = c2 − 2 −1 hν 1 kT −1 e This is an expression with all values known except T. Solve for T and we have T = 5.877 × 10 9 K 8. Considering your answers to 6 and 7, explain why lasers can be useful light sources for spectroscopy. Conversely, for what type of application might a laser not necessarily be a good light source? We can see that the laser holds enormous advantage in number of photons emitted over small frequency ranges. For the two examples in problems 6 and 7, the laser emits ~ 102 more photons from an equivalent surface area. But keep in mind that the frequency range ∆ν for the blackbody in Problem 6 was ~ 107 times larger than for the laser. Thus, we can estimate about a 109 greater emission from the laser over a roughly equivalent frequency interval and from an equivalent area. This is why the effective temperature calculated for a blackbody to give approximately the same emission as the laser is so ridiculously (and unattainably) high. Thus, lasers are completely “unnatural” light sources, and we can take advantage of this in spectroscopic applications. For experiments for which we want to keep the wavelength fixed (provided we have a laser that gives us the wavelength that we want), the higher power density from the laser will allow us to attain equivalent signal as a thermal source for much lower concentration of analyte or over much shorter time. The shorter the acquisition time, the more averaging we can do for increased signal to noise. The high power density also allows us to detect signal from processes that are much less probable, for example due to selection rules. Thermal sources do have value when we need broad spectral output, for example in scanning spectra. Some lasers have relatively broad spectral output (for example the dye lasers and Ti:sappire laser we discussed in class) and are useful in scanning spectral experiments, but don’t approach the bandwidth of thermal sources. Lasers are also pretty expensive compared to light bulbs. If you don’t need it for a given application, don’t waste your money on it.


