Data Center Containment ROI
advertisement
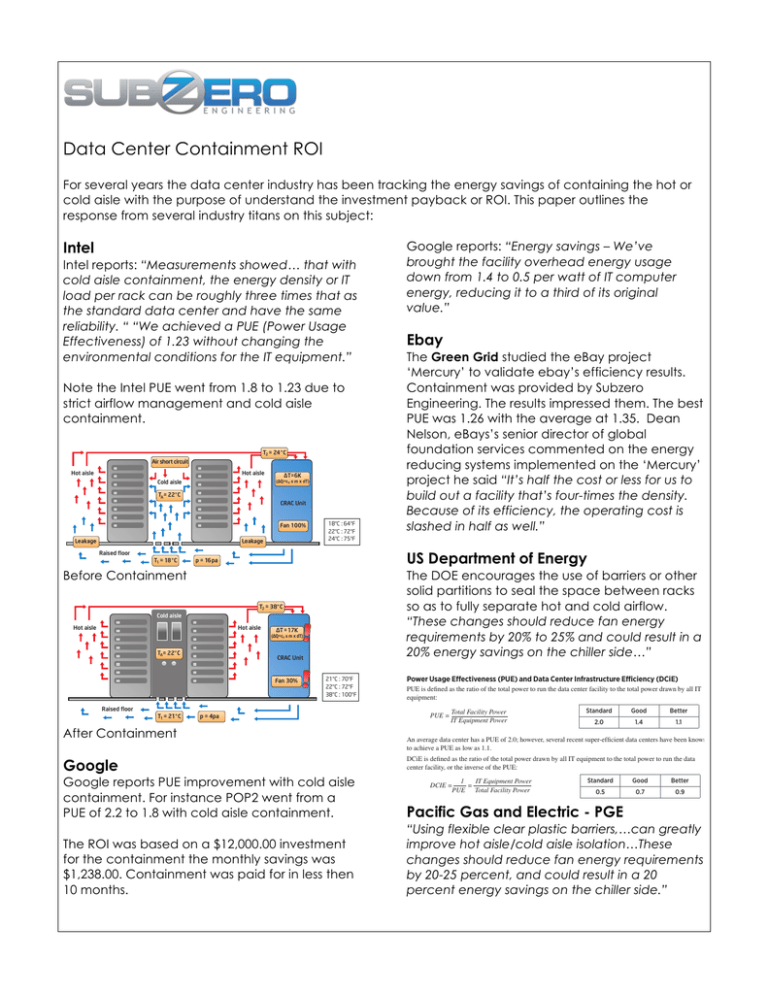
Data Center Containment ROI For several years the data center industry has been tracking the energy savings of containing the hot or cold aisle with the purpose of understand the investment payback or ROI. This paper outlines the response from several industry titans on this subject: WHITE PAPER – DataCenter 2020 Intel The following figure depicts the changes resulting from reducing the leakage in the raised floor and the cold aisle containment, and the computer inlet temperature (TA) remains constant at 22 °C. In the next step (see White Paper: Delivering high density in the Data Center; efficiently and reliably), the DataCenter 2020 team increased the IT load to 22kW/rack to see how the PUE or the efficiency of data center infrastructure may depend on the energy density. The computer’s inlet temperature (TA) remained constant still at 22 °C. Intel reports: “Measurements showed… that with cold aisle containment, the energy density or IT They chose two scenarios: times that as load per rack can be roughly three • In the first scenario, they used a single CRAH. The external the standard data centercirculation andwater have the was same supply temperature kept at 8 °C. The resultant PUE decreased at an energy density of 22 kW/rack reliability. “ “We achieveddown atoPUE (Power Usage 1.32. • In the second scenario, they established an energy density of Effectiveness) of 1.23 without the 10kW/rackchanging with two CRAHs operating with a water supply The air flow also slows down due to the reduced fan speed. Since temperature of 16 °C. The two CRAH fan speeds were reduced theenvironmental air then absorbs more heat, the returnconditions air temperature (T ) for the IToneequipment.” accordingly. With only half of the airflow needed with two By sealing the raised floor and providing a clear separation of cold and warm air we increased the pressure in the raised floor and increased the ΔT in the CRAH cooling coil (ΔT = difference between return air and supply air temperature) from 6 to 17 °C. This means that the CRAH will operate much more efficiently than before. Additionally, the fan speed was reduced to 30 percent (previously at 100 percent). Because of the fan power laws, this means that the fan motor consumes about 90 percent less energy. 2 is increased from 24 °C to 38 °C. Also, the inlet temperature (T1) under the raised floor can be increased from 18 °C to 21 °C. Since the computer inlet temperature TA is still at 22 °C, a very small temperature gradient between the raised floor and server inlet temperature is achieved. CRAHs operational, only one quarter of the power was needed in each unit as compared with single unit operation. The higher water-supply temperature also reduces the use of chillers. This also allowed a greater use of indirect free cooling for more hours per year, which also reduces the total energy expenditure. This allowed the team to further reduce the PUE value to 1.23. Note the Intel PUE went from 1.8 to 1.23 due to strict airflow management and cold aisle containment. WHITE PAPER – DataCenter 2020 T2 = 24 ° C Airwell short Overall, it was found that energy densities incircuit excess of 20 kW/rack Hot could aisle be supported safely and with good availability using standard technology in conventional CRAH based cooling. Cold aisle The structured use of the optimization steps outlined in our first white paper remains the best path. TA= 22° C New measures: hot aisle containment In the nextHot step,aisle the researchers conducted the same measure∆T=6K ments, but this time using a hot-aisle containment to examine (∆Q=c v x m x dT) the preferred performance in comparison to standard configurations (hot aisle/cold aisle) and to compare it with the cold-aisle CRAC existed Unit in the market on each containment. Different opinions The cold aisle containment becomes more important at higher configuration’s efficiency advantages, but nothing had been energy densities and plays a more important supporting role in established empirically. Regardless of the selected enclosure failure scenarios. The measurements showed that, with sepa18°C 64°F inlet Fan 100% type, if the servers are operated the same, with the: same ration of cold and warm air (leakage sealing, cold aisle contain22°C : 72°F temperature and the airflow path is controlled, the energy ment), the energy density or IT load per rack can increase by 24°C : 75°F Leakage Leakage consumption and the amount of dissipated heat to be cooled approximately three times - and yet with the same reliability are identical in both systems. For the measurements made with as in the case without containment. In addition, we benefited Raised floor from a nearly three-fold higher run time inT the event of comp = 16 pacold-aisle containment, the CRAH operated most efficiently with 1 = 18 ° C a temperature difference ΔT of 17 °C (air temperature 38 °C, plete failure of the air supply. air temperature 21 °C). Before Containment Figure 1 (corresponding to Figure 2 from the previous White Paper) T2 = 38° C Cold aisle Hot aisle Hot aisle ∆T =17K (∆Q=cv x m x dT) TA= 22° C CRAC Unit Fan 30% Raised floor T1 = 21° C Google reports: “Energy savings – We’ve brought the facility overhead energy usage down from 1.4 to 0.5 per watt of IT computer energy, reducing it to a third of its original value.” Ebay The Green Grid studied the eBay project ‘Mercury’ to validate ebay’s efficiency results. Containment was provided by Subzero Engineering. The results impressed them. The best PUE was 1.26 with the average at 1.35. Dean Nelson, eBays’s senior director of global foundation services commented on the energy reducing systems implemented on the ‘Mercury’ project he saidSummary “It’s half the cost or less for us to | Background | Data Information Center Metrics Technologies and Benchmarking (IT) Systems build out a facility that’s four-times the density. Because of its efficiency, the operating cost is A potentially more efficient and more reliable thermally driven technology that has entered the domestic market is the adsorption chiller. An adsorbent a silica gel desiccant based cooling system that uses waste heat to slashed in half as iswell.” regenerate the desiccant and cooling towers to dissipate the removed heat. The process is similar to that of an absorption process but simpler and, therefore, more reliable. The silica gel based system uses water as the refrigerant and is able to use lower temperature waste heat than a lithium bromide based absorption chiller. Adsorption chillers include better automatic load matching capabilities for better part-load efficiency compared to absorption chillers. The silica gel adsorbent is non-corrosive and requires significantly less maintenance and monitoring compared to the corrosive lithium bromide absorbent counterpart. Adsorption chillers generally restart more quickly and easily compared to absorption chillers. While adsorption chillers have been in production for more than 20 years, they have only recently been introduced in the U.S. market. US Department of Energy The DOE encourages the use of barriers or other solid partitions to seal the space between racks so as to fully separate hot and cold airflow. Data Center Metrics and Benchmarking “These changes should reduce fan energy Energy efficiency metrics and benchmarks can be used to track the performance of and identify potential opportunities to reduce energyby use in 20% data centers. each of the metricscould listed in this section, benchmarking requirements toFor25% and result in a values are provided for reference. These values are based on a data center benchmarking study carried out by 20% energy savings on the chiller side…” Lawrence Berkeley National Laboratories. The data from this survey can be found under LBNL’s Self-Benchmarking Guide for Data Centers: http://hightech.lbl.gov/benchmarking-guides/data.html 21°C : 70°F 22°C : 72°F 38°C : 100°F p = 4pa After Containment Figure 2, corresponds to Figure 3 in the second White Paper Google Power Usage Effectiveness (PUE) and Data Center Infrastructure Efficiency (DCiE) PUE is defined as the ratio of the total power to run the data center facility to the total power drawn by all IT equipment: PUE = Total Facility Power IT Equipment Power Standard Good Better 2.0 1.4 1.1 An average data center has a PUE of 2.0; however, several recent super-efficient data centers have been known to achieve a PUE as low as 1.1. DCiE is defined as the ratio of the total power drawn by all IT equipment to the total power to run the data center facility, or the inverse of the PUE: Google reports PUE improvement with cold aisle containment. For instance POP2 went from a PUE of 2.2 to 1.8 with cold aisle containment. Pacific Gas and Electric - PGE The ROI was based on a $12,000.00 investment for the containment the monthly savings was $1,238.00. Containment was paid for in less then 10 months. It is important to note that these clear two terms—PUE and DCiE—do not define the overall efficiency of an “Using flexible plastic barriers,…can greatly entire data center, but only the efficiency of the supporting equipment within a data center. These metrics could be alternatively defined using units of average annual power or annual energy (kWh) rather than improve hot aisle/cold aisle isolation…These an instantaneous power draw (kW). Using the annual measurements provides the advantage of accounting for variable free-coolingshould energy savings reduce as well as the trend for dynamic IT loads due to practices such as IT changes fan energy requirements power management. by 20-25 percent, and could result in a 20 PUE and DCiE are defined with respect to site power draw. Another alternative definition could use a source power measurementenergy to account for different fuel source uses.the chiller side.” percent savings on 1 IT Equipment Power DCIE = = PUE Total Facility Power Standard Good Better 0.5 0.7 0.9 The Green Grid developed benchmarking protocol for these two metrics for which references and URLs are provided at the end of this guide. Energy Star defines a similar metric, defined with respect to source energy, Source PUE as: Source PUE = Total Facility Energy (kWh) UPS Energy (kWh) FEDERAL ENERGY MANAGEMENT PROGRAM 17 Oracle Oracle uses a high-density hot air containment system within the high power density section of their data center. The system creates a physical barrier between hot and cold air streams. Thus it avoids mixing and excess airflow. Thus temperature set points are raised and CRAC unit fan usage lowered. “Star Wars” and Indiana Jones” participated in a US Energy DOE program for the reduction of energy in their data center. By improving airflow Utilizing theRecommendations isolation of hot and cold airflow the Assessment energy reduction was $89,000.00 per year with a simple payback of 1.3 years. Measure Fan power use in the conventional hot/cold aisle section and the new high-­ density containment section Fan Power Comparison Conventional Hot/Cold Aisle Section HDHC Rack Section Total IT Equipment Load, 4375.1 kW 2336.9 Number of CRAC Fans 63 27 CRAC Fan Power, kW 55@ 7.45 kW and 8 @11.19 kW/each 4.69 kW/each Rack Exhaust Fan Power, kW 0 500 @ 0.07 kW/each Total Fan Power, kW 499.3 158.1 Fan Power per Unit IT Equipment Load (kW/ kW) 0.114 0.068 Says Oracle “The estimated payback period of 19 months was achieved far sooner because the variable speed fans operated at much lower speeds.” Lawrence Berkeley National laboratory The LBNL project was to determine the operational and energy benefits of more efficient data center air management techniques. By minimizing air mixing, and allowing the temperature difference between the supply and return air to increase, LBNL was able to reduce fan power by 75%. Increase capacity of CRAH units were between 39% 49%. Raising chilled water supply temperature to 50 degrees saved 4% in chiller energy. Summary of Potential Energy Savings for Data Center Ut wisi enim ad minim veniam, quis nostrud exerci tation ullamcorper susDemand cipit lobortis nisl ut aliquip ex ea comAnnual Energy Reduction modo % Reduction in Duis%autem Reduction in consequat. vel eum Finding Savings (kWh) (kW) Cooling Energy iriure dolorEnergy in hendreritTotal in vulputate velit esse molestie consequat, vel illum N/A dolore eu feugiat nulla facilisis at vero 2 740,000 84.2 1.8%digniseros et 12% accumsan et iusto odio sim qui blandit praesent luptatum zzril 3 N/A delenit augue duis dolore te feugait nulla facilisi. dolor sit 4 110,000 12.2 3.2% Lorem ipsum 0.3% amet, consectetuer adipiscing elit, sed 5 N/A diam nonummy nibh euismod tincidunt ut laoreet dolore magna aliquam erat 6 210,000 24.5 3.3% 0.5% volutpat. Ut wisi 18% enim ad minim veniam, 7 1,140,000 24.5 2.8%quis nostrud exerci tation ullamcorper suscipit lobortis nisl ut aliquip ex ea comFindings marked with “N/A” either increase capacity rather than save energy or modo consequat. Duis autem vel eum are qualitative observations. iriure dolor in hendrerit in vulputate velit esse molestie consequat, vel illum dolore eu feugiat nulla facilisis at vero eros company et accumsan et iusto odio dignisLucasfilm Ltd the production sim qui blandit praesent luptatum zzril responsible for award-winning movies such as delenit augue duis dolore te feugait nulla facilisi. Lorem ipsum dolor sit amet, consectetuer adipiscing elit, sed diam nonummy nibh euismod tincidunt ut laoreet dolore magna aliquam erat volutpat. Ut wisi enim ad minim veniam, quis nostrud exerci tation 1 Lucasfilm kWh/year About theredundant Energyrack 109,500 Remove mounted UPS Center Efficient Data Turn servers off during Demonstration Project downtime/power The project’s goal is to identify key management technology, policy and implementation chillerstotoengage main- in creating expertsStage and partners high load factor a series tain of demonstration projects that show emerging and best887,300 Operate technologies UPS in switched availableby-pass energy mode efficiency technologies and practices associated with operating, Improve airflow equipping and constructing data centers. The project aimed to identify Implement water-side demonstrations for each of the three main economizer categories that impact data center energy Install lighting controls 10,500 utilization: • operation & capital Total for all efficiency measures 3,109,200 Cost Savings/ year Capital Cost ($) Simple Payback (years) $0 JNNFEJBUF $30,000 $10,000 $10,000 $98,000 $100,000 t -FBSONPS $89,000 $113,000 t 4JHOVQGPS $103,000 Visit the Sav &GmDJFODZ $1,000 $343,000 $429,500 1.2 • equipment (server, storage & networking equipment) • dataRemove center design & construction (power UPS systems redundant rack mounted distribution & transformation, cooling systems, configuration, and energy How much money raising the cooling sources, etc.). Microsoft set point in the data center can save? Don Denning the Turn also servers off member The project identified critical facilities manager at Lee Technologies organizations that have retrofitted existing data centers and/or built new ones which worked on the Microsoft project said “We where Stage some orchillers all of these practices and tofloor maintain high load factor four degrees and raised the temperature technologies are being incorporated into saved $250,000.00 annual energy costs.” Data their designs, construction and operations. center containment is the most efficient means About The Silicon to ensure safeValley increases in cooling set point Leadership Group (SVLG) temperature. Operate UPS in switched by-pass mode The SVLG comprises principal officers and senior managers of member companies who work with local, regional, state, and federal government to address Engineering has installed As of 2012 Improve airofficials flowSubzero major public policy issues affecting the containment economic health and quality ofsystems life in Silicon in hundreds of data Valley.centers The Leadership Group’s vision is the world. Regardless of throughout Implement water-side to ensure the economic health andeconomizer a high location elevation, all data centers have quality of life in Siliconor Valley for its entire community by advocating for adequate realized huge energy savings. In many affordable housing, comprehensive applications CRAC units were turned off. Most of regional transportation, reliable energy, a The project’s goaland is to identify key quality K-­12 higher education the containment systems were able to lower the Install lighting controlssystem, technology, policy and implementation a prepared workforce, a sustainable IT temperature inlet over 10 degrees. The lower experts and partners to engage in creating environment, affordable and available a series of demonstration projects that healthcold care, andaisle businesstemperatures and tax policies enabled managers to show emerging technologies and best that keep California and Silicon Valley available energy efficiency technologies increase temperature set points and lower competitive. and practices associated with operating, Relative Humidity set points. It is common for the equipping and constructing data © 2008 Silicon Valley to Leadership Group centers. The project aimed identify AC cooling capacity to double. While each demonstrations for each of the three main For permission to reproduce this content center varied the one categoriesdata that impact data center circumstances energy contact the Leadership Group at utilization:consistent response from our customers was a http://svlg.net • operation & capital efficiency Subzero Engineering About the Energy Efficient Data Center Demonstration Project ROI inside of 12 months while at the same time increasing server reliability. • equipment (server, storage & networking equipment) • data center design & construction (power distribution & transformation, cooling systems, configuration, and energy sources, etc.). For more information www.subzeroeng.com The project also identified member 801 810 3500 organizations that have retrofitted existing data centers and/or built new ones where some or all of these practices and technologies are being incorporated into their designs, construction and operations. About The Silicon Valley t %PXOMPBE POMJOFTPGU RVJDLMZEJB EBUBDFOUF www Public-Pri The U.S. Dep Technologies at Lucasfilm assessment Energy Now efficiency ass in data cente competitiven A Strong En Energy efficien a stronger eco energy indepen of state, comm U.S. Departme Renewable Ene technologies. 'PSBEEJUJPOBM *OEVTUSJBM5FDI www.eere.ene &&3&*OGPSNBU &&3&*/ www.eere.ene %0&(0 0DUPCFS
