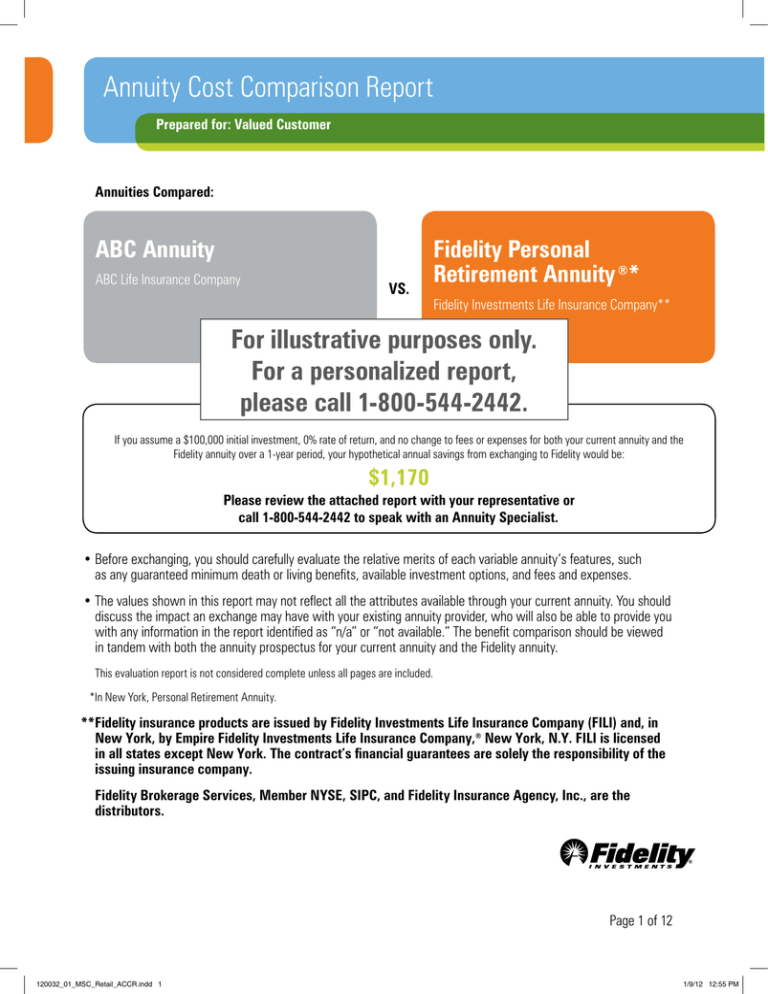
Annuity Cost Comparison Report
Prepared for: Valued Customer
Annuities Compared:
ABC Annuity
ABC Life Insurance Company
vs.
Fidelity Personal
Retirement Annuity ®*
Fidelity Investments Life Insurance Company**
For illustrative purposes only.
For a personalized report,
please call 1-800-544-2442.
If you assume a $100,000 initial investment, 0% rate of return, and no change to fees or expenses for both your current annuity and the
Fidelity annuity over a 1-year period, your hypothetical annual savings from exchanging to Fidelity would be:
$1,170
Please review the attached report with your representative or
call 1-800-544-2442 to speak with an Annuity Specialist.
• B efore exchanging, you should carefully evaluate the relative merits of each variable annuity’s features, such
as any guaranteed minimum death or living benefits, available investment options, and fees and expenses.
• T he values shown in this report may not reflect all the attributes available through your current annuity. You should
discuss the impact an exchange may have with your existing annuity provider, who will also be able to provide you
with any information in the report identified as “n/a” or “not available.” The benefit comparison should be viewed
in tandem with both the annuity prospectus for your current annuity and the Fidelity annuity.
This evaluation report is not considered complete unless all pages are included.
*In New York, Personal Retirement Annuity.
**Fidelity insurance products are issued by Fidelity Investments Life Insurance Company (FILI) and, in
New York, by Empire Fidelity Investments Life Insurance Company,® New York, N.Y. FILI is licensed
in all states except New York. The contract’s financial guarantees are solely the responsibility of the
issuing insurance company.
Fidelity Brokerage Services, Member NYSE, SIPC, and Fidelity Insurance Agency, Inc., are the
distributors.
Page 1 of 12
120032_01_MSC_Retail_ACCR.indd 1
1/9/12 12:55 PM
Release date 11-30-2011
Page 2 of 12
Annuity Cost Comparison Report
Expense & Surrender Charge Analysis
Current Contract
New Contract
ABC Annuity
Fidelity Personal Retirement Annuity
How a Change in Fees May Affect Your Annuity
1
If you assume a $100,000 initial investment for both your current annuity and the Fidelity annuity, and also assume a 0% rate of return and your actual
annuities’ fees and expenses based on a one-year period, the estimated Fidelity annuity cost difference would be $1,170.
Hypothetical Cost Comparison2
Total Expense Ratio
2.29%
Hypothetical Account Value
$100,000
Total Expense Ratio
Hypothetical Account Value
1.12%
$100,000
Base Insurance Expenses
$1,200
Base Insurance Expenses
$250
Subaccount Expenses
$1,090
Subaccount/Fund Management Expenses
$870
Optional Benefit Expenses
$0
Estimated Annual Fees
$2,290
Optional Benefit Expenses
Estimated Annual Fees
$0
$1,120
Hypothetical Savings/Additional Cost for Year 13$1,170
E
L
P
1-Year Hypothetical Comparison
Remain in Current Contract
Current Value
$100,000
Plus New Investment
Net Investment
Estimated Annual Fees
$0
Transfer/Exchange to Fidelity
Investment before Transfer/Exchange
Plus New Investment
$0
Minus Annuity Surrender Charge
$0
M
A
S
End of first-year value assuming 0% hypothetical return
Surrender Charge Expiration Date
$100,000
Net Investment
$2,290
Estimated Annual Fees
$97,710
End of first-year value assuming 0% hypothetical return
N/A
$100,000
$100,000
$1,120
$98,880
Customers should carefully evaluate the implications of any surrender charge penalty to determine whether it is in their best interest to incur any such
penalty. In many cases, a customer would be better served to continue their existing contract until surrender charges no longer apply.
Additional Features and Benefits
Generally, a guaranteed minimum death benefit provides a guaranteed minimum value for beneficiary(ies) in the event the annuitant and/or owner
dies before electing the lifetime income payment option. Additional death benefit options may be available for an extra fee. Generally, at death, these
additional options provide the highest contract value on a specified date and/or an annual increasing amount based on the initial investment. Living
benefit options, which may provide insurance against a reduction in contract value or income during the owner’s and/or annuitant’s lifetime, may also
be available for an extra fee. Guarantees are subject to the claims-paying ability of the issuing insurance company. Fidelity Personal Retirement
Annuity ® does not offer a guaranteed minimum death benefit. However, like all deferred variable annuities, a standard death benefit is
included and pays the beneficiary(ies) the current contract value if the annuity owner dies prior to the annuity date.
Benefit Values
Standard Death Benefit
Current Guaranteed Death Benefit Value
Yes
$100,000
Fidelity Investments strongly advises customers whose existing annuity
has a guaranteed death benefit with a value that exceeds the contract
value and/or living benefits to consider retaining their existing annuity
to avoid forfeiture of the benefits protection.
AM Best Financial Strength Rating4A+
Standard Death Benefit
Initial Guaranteed Death Benefit Value
Yes
None
AM Best Financial Strength Rating4A+
© 2011 Morningstar, Inc. All rights reserved. The information, data, analyses, and opinions contained herein (1) include the confidential and
proprietary information of Morningstar, (2) may not be copied or redistributed, (3) do not constitute investment advice offered by Morningstar,
(4) are provided solely for informational purposes and therefore are not an offer to buy or sell a security, and (5) are not warranted to be correct,
complete, or accurate. Except as otherwise required by law, Morningstar shall not be responsible for any trading decisions, damages, or other
losses resulting from, or related to, this information, data, analyses, or opinions, or their use.
120032_01_MSC_Retail_ACCR.indd 2
1/9/12 12:55 PM
Release date 11-30-2011
Page 3 of 12
Annuity Cost Comparison Report
Expense & Surrender Charge Analysis
Current Contract
New Contract
ABC Annuity
Fidelity Personal Retirement Annuity
Fee and Expense Detail
Annual annuity fees and fund management expenses may impact the tax-deferred growth potential of your annuity. Before deciding to exchange,
determine if you are paying for features you do not need or receiving fewer features for your money.
Annual Contract Fee
$0
Annual Contract/Account Fee
$0
Contract Fee Waived For
$0
Contract Fee Waived For
$0
Max Front Load
0.00%
Annual Insurance Expenses
Mortality and Expense Risk
Max Front Load
0.00%
Annual Insurance/Account Expenses
0.75%
Mortality and Expense Risk50.20%
Administrative Expense
0.25%
Administrative Expense
0.05%
Distribution Expense
0.20%
Distribution Expense
0.00%
E
L
P
Subaccount Expenses61.09%
Subaccount/Fund Management Expenses6
0.87%
Optional Benefit Expenses
Optional Benefit Expenses
0.00%
0.00%
Total Expense Ratio72.29%
Total Expense Ratio71.12%
M&E Note: Variable investment options only.
Adm Expense Note: Variable investment options only.
M&E Note: Variable investment options only.
Adm Expense Note: Variable investment options only.
M
A
S
Surrender Charge Schedule
Surrender charges on withdrawals may restrict the liquidity of your investment for a number of years. You could be charged a surrender penalty for excess
withdrawals made during that specified period of time. There are no surrender charges with this Fidelity annuity.
Surrender Charge Schedule%
Surrender Charge Schedule%
0–1 Years
1–2 Years
2–3 Years
7.00
0–1 Years
0.00
6.00
1–2 Years
0.00
5.00
2–3 Years
0.00
3–4 Years
4.00
3–4 Years
0.00
4–5 Years
3.00
4–5 Years
0.00
5–6 Years
2.00
5–6 Years
0.00
6–7 Years
1.00
6–7 Years
0.00
7–8 Years
0.00
7–8 Years
0.00
8–9 Years
0.00
8–9 Years
0.00
9–10 Years
0.00
9–10 Years
0.00
© 2011 Morningstar, Inc. All rights reserved. The information, data, analyses, and opinions contained herein (1) include the confidential and
proprietary information of Morningstar, (2) may not be copied or redistributed, (3) do not constitute investment advice offered by Morningstar,
(4) are provided solely for informational purposes and therefore are not an offer to buy or sell a security, and (5) are not warranted to be correct,
complete, or accurate. Except as otherwise required by law, Morningstar shall not be responsible for any trading decisions, damages, or other
losses resulting from, or related to, this information, data, analyses, or opinions, or their use.
120032_01_MSC_Retail_ACCR.indd 3
1/9/12 12:55 PM
Release date 11-30-2011
Page 4 of 12
Annuity Cost Comparison Report
Investment Analysis
Current Contract
New Contract
ABC Annuity
Fidelity Personal Retirement Annuity
Morningstar Rating Summary8 as of 11-30-2011
Morningstar RatingTM is calculated for subaccounts with at least a three-year history. It is calculated based on a Morningstar Risk-Adjusted return measure
that accounts for variation in a subaccount’s monthly performance, placing more emphasis on downward variations and rewarding consistent performance.
The top 10% of subaccounts in each category receive 5 stars, the next 22.5% receive 4 stars, the next 35% receive 3 stars, the next 22.5% receive 2
stars, and the bottom 10% receive 1 star. The Overall Morningstar Rating for a subaccount is derived from a weighted average of the performance figures
associated with its three-, five-, and ten-year (if applicable) Morningstar Rating metrics. Past performance is no guarantee of future results.
Investment Options
63
Overall
3 Year
5 Year
10 Year
HHHHH ————
Investment Options
55
Overall
3 Year
5 Year
10 Year
HHHHH ————
HHHH
————
HHHH
————
HHH
————
HHH
————
E
L
P
HH
————
HH
————
H
————
H
————
Not Rated ————
Not Rated ————
Total Options
————
Total Options
————
M
A
S
Portfolio Style Summary 9 as of 11-30-2011
The Morningstar Style Box reveals a fund’s investment strategy. For equity funds, the vertical axis shows the market capitalization of the long stocks
owned and the horizontal axis shows investment style (value, core, or growth). For fixed-income funds, the vertical axis shows the credit quality of the
long bonds owned and the horizontal axis shows interest rate sensitivity as measured by a bond’s effective duration.
l 4–6 Funds
l 1–3 Funds
19
14
High
2
1
3
4
2
Small
1
11
Value
Core
Growth
6
19
16
High
10
Med
Mod
3
1
2
Med
Growth
Ext
Fixed Income Style Distribution %
10
Low
Core
Low
Ltd
Equity Style Distribution %
Large
Fixed Income Style Distribution %
Value
Small
l 4–6 Funds
Investment Portfolio Style
Mid
Equity Style Distribution %
l 7+ Funds
Large
Investment Portfolio Style
l 1–3 Funds
Mid
l 7+ Funds
5
1
Ltd
Mod
Ext
1
© 2011 Morningstar, Inc. All rights reserved. The information, data, analyses, and opinions contained herein (1) include the confidential and
proprietary information of Morningstar, (2) may not be copied or redistributed, (3) do not constitute investment advice offered by Morningstar,
(4) are provided solely for informational purposes and therefore are not an offer to buy or sell a security, and (5) are not warranted to be correct,
complete, or accurate. Except as otherwise required by law, Morningstar shall not be responsible for any trading decisions, damages, or other
losses resulting from, or related to, this information, data, analyses, or opinions, or their use.
120032_01_MSC_Retail_ACCR.indd 4
1/9/12 12:55 PM
Release date 11-30-2011
Page 5 of 12
Annuity Cost Comparison Report
Investment Analysis
New Contract
Fidelity Personal Retirement Annuity
Hollow stars indicate that pre-inception return data was used to calculate the subaccount’s star rating. Pre-inception returns are based on the oldest
share class of the underlying fund, and are adjusted to reflect the fees and expenses of the share class available within the annuity, as well as the
additional fees of the annuity. Note: Once a share class has at least three years of actual history, pre-inception returns are no longer used to determine
the subaccount’s overall rating; instead, the respective class’s own rating(s) are used to calculate the overall rating.
Subaccounts
Category
Rating
Overall
3-Year
Rating
5-Year
Rating
10-Year
Rating
FPRA I-Fidelity VIP FundsManager 85% Inv
Aggressive Allocation
—
—
—
—
FPRA I-Fidelity VIP Telecommunications Inv
Communications
—
—
—
—
FPRA I-Fidelity VIP FundsManager 20% Inv
Conservative Allocation
—
—
—
—
—
—
—
—
—
—
—
—
—
—
—
—
—
—
—
—
—
—
—
—
—
—
—
—
—
—
—
—
—
—
—
—
—
—
—
—
—
—
—
—
—
—
—
—
FPRA I-Fidelity VIP Consumer Discretionary Inv Consumer Cyclical
FPRA I-Fidelity VIP Consumer Staples Inv
Consumer Defensive
FPRA I-Fidelity VIP Emerging Mkts Inv R
Diversified Emerging Mkts
E
L
P
FPRA I-Lazard Retirement Emerging Mkts Eq Inv Diversified Emerging Mkts
FPRA I-UIF Emerg Mkts Equity I
Diversified Emerging Mkts
FPRA I-UIF Emerg Mkts Debt I
Emerging Markets Bond
FPRA I-Fidelity VIP Financial Services Inv
Financial
FPRA I-Fidelity VIP Overseas Inv R
Foreign Large Blend
FPRA I-Fidelity VIP Intl Capital Apprec Inv R
Foreign Large Growth
FPRA I-Fidelity VIP Health Care Inv
Health
FPRA I-Fidelity VIP High Income Inv
High Yield Bond
FPRA I-Fidelity VIP Industrials Inv
Industrials
—
—
—
—
FPRA I-PIMCO VIT Real Return Admin
Inflation-Protected Bond
—
—
—
—
FPRA I-Fidelity VIP Investment Grade Bond Inv Intermediate-Term Bond
—
—
—
—
FPRA I-PIMCO VIT Total Return Admin
Intermediate-Term Bond
—
—
—
—
FPRA I-Fidelity VIP Contrafund Inv
Large Blend
—
—
—
—
FPRA I-Fidelity VIP Index 500 IC
Large Blend
—
—
—
—
FPRA I-Fidelity VIP Materials Inv
Large Blend
M
A
S
—
—
—
—
FPRA I-Fidelity VIP Dynamic Capital Apprec Inv Large Growth
—
—
—
—
FPRA I-Fidelity VIP Growth & Income Inv
Large Growth
—
—
—
—
FPRA I-Fidelity VIP Growth Inv
Large Growth
—
—
—
—
FPRA I-Fidelity VIP Growth Opportunities Inv
Large Growth
—
—
—
—
FPRA I-Fidelity VIP Growth Stock Inv
Large Growth
—
—
—
—
FPRA I-Fidelity VIP Equity-Income Inv
Large Value
—
—
—
—
FPRA I-Fidelity VIP Value Leaders Inv
Large Value
—
—
—
—
FPRA I-Fidelity VIP Value Strategies Inv
Mid-Cap Blend
—
—
—
—
FPRA I-Fidelity VIP Growth Strategies Inv
Mid-Cap Growth
—
—
—
—
FPRA I-Fidelity VIP Mid Cap Inv
Mid-Cap Growth
—
—
—
—
FPRA I-Fidelity VIP Value Inv
Mid-Cap Value
—
—
—
—
FPRA I-Fidelity VIP Asset Manager Inv
Moderate Allocation
—
—
—
—
FPRA I-Fidelity VIP Asset Manager: Growth Inv Moderate Allocation
—
—
—
—
© 2011 Morningstar, Inc. All rights reserved. The information, data, analyses, and opinions contained herein (1) include the confidential and
proprietary information of Morningstar, (2) may not be copied or redistributed, (3) do not constitute investment advice offered by Morningstar,
(4) are provided solely for informational purposes and therefore are not an offer to buy or sell a security, and (5) are not warranted to be correct,
complete, or accurate. Except as otherwise required by law, Morningstar shall not be responsible for any trading decisions, damages, or other
losses resulting from, or related to, this information, data, analyses, or opinions, or their use.
120032_01_MSC_Retail_ACCR.indd 5
1/9/12 12:55 PM
Release date 11-30-2011
Page 6 of 12
Category
Rating
Overall
3-Year
Rating
5-Year
Rating
10-Year
Rating
FPRA I-Fidelity VIP Balanced Inv
Moderate Allocation
—
—
—
—
FPRA I-Fidelity VIP FundsManager 50% Inv
Moderate Allocation
—
—
—
—
FPRA I-Fidelity VIP FundsManager 60% Inv
Moderate Allocation
—
—
—
—
FPRA I-Fidelity VIP FundsManager 70% Inv
Moderate Allocation
—
—
—
—
FPRA I-Fidelity VIP Money Market Inv
Money Market-Taxable
—
—
—
—
FPRA I-Fidelity VIP Strategic Income Inv
Multisector Bond
—
—
—
—
FPRA I-Fidelity VIP Energy Inv
Natural Resources
—
—
—
—
FPRA I-Fidelity VIP Real Estate Inv
Real Estate
—
—
—
—
FPRA I-Fidelity VIP Investor Freedom Income Inv Retirement Income
—
—
—
—
FPRA I-PIMCO VIT Low Duration Admin
Short-Term Bond
—
—
—
—
FPRA I-Fidelity VIP Discp Small Cap Inv
Small Blend
—
—
—
—
FPRA I-Fidelity VIP Investor Freedom 2005 Inv Target Date 2000–2010
—
—
—
—
FPRA I-Fidelity VIP Investor Freedom 2010 Inv
Target Date 2000–2010
—
—
—
—
FPRA I-Fidelity VIP Investor Freedom 2015 Inv
Target Date 2011–2015
—
—
—
—
FPRA I-Fidelity VIP Investor Freedom 2020 Inv Target Date 2016–2020
—
—
—
—
FPRA I-Fidelity VIP Investor Freedom 2025 Inv Target Date 2021–2025
—
FPRA I-Fidelity VIP Investor Freedom 2030 Inv Target Date 2026–2030
—
FPRA I-Fidelity VIP Technology Inv
Technology
—
FPRA I-Fidelity VIP Utilities Inv
Utilities
—
FPRA I-UIF Global Tactical Asset Allocation
World Allocation
—
E
L
P
M
A
S
FPRA I-Invesco Van Kampen VI Glbl Val Eq Ses I World Stock
—
—
—
—
—
—
—
—
—
—
—
—
—
—
—
—
—
—
—
© 2011 Morningstar, Inc. All rights reserved. The information, data, analyses, and opinions contained herein (1) include the confidential and
proprietary information of Morningstar, (2) may not be copied or redistributed, (3) do not constitute investment advice offered by Morningstar,
(4) are provided solely for informational purposes and therefore are not an offer to buy or sell a security, and (5) are not warranted to be correct,
complete, or accurate. Except as otherwise required by law, Morningstar shall not be responsible for any trading decisions, damages, or other
losses resulting from, or related to, this information, data, analyses, or opinions, or their use.
120032_01_MSC_Retail_ACCR.indd 6
1/9/12 12:55 PM
Release date 11-30-2011
Page 7 of 12
Annuity Cost Comparison Report
Investment Analysis
Current Contract
ABC Annuity
Hollow stars indicate that pre-inception return data was used to calculate the subaccount’s star rating. Pre-inception returns are based on the oldest
share class of the underlying fund, and are adjusted to reflect the fees and expenses of the share class available within the annuity, as well as the
additional fees of the annuity. Note: Once a share class has at least three years of actual history, pre-inception returns are no longer used to determine
the subaccount’s overall rating; instead, the respective class’s own rating(s) are used to calculate the overall rating.
Subaccounts
Category
Rating
Overall
3-Year
Rating
5-Year
Rating
10-Year
Rating
Intl Grw A
Foreign Large Blend
—
—
—
—
Inter Bd A
Intermediate-Term Bond
—
—
—
—
Lg Cp Gr A
Large Growth
—
—
—
—
Growth A
Large Growth
—
—
—
—
Grth & Inc A
Large Value
—
—
—
—
Blncd Shrs
Moderate Allocation
—
—
—
—
Money Market
Money Market-Taxable
—
—
—
—
Sm Cp Gr A
Small Growth
—
—
—
—
Real Est A
Specialty-Real Estate
—
—
—
—
—
—
—
—
—
—
—
—
Glb Tech A
Util Inc A
M
A
S
E
L
P
Specialty-Technology
Specialty-Utilities
© 2011 Morningstar, Inc. All rights reserved. The information, data, analyses, and opinions contained herein (1) include the confidential and
proprietary information of Morningstar, (2) may not be copied or redistributed, (3) do not constitute investment advice offered by Morningstar,
(4) are provided solely for informational purposes and therefore are not an offer to buy or sell a security, and (5) are not warranted to be correct,
complete, or accurate. Except as otherwise required by law, Morningstar shall not be responsible for any trading decisions, damages, or other
losses resulting from, or related to, this information, data, analyses, or opinions, or their use.
120032_01_MSC_Retail_ACCR.indd 7
1/9/12 12:55 PM
Release date 11-30-2011
Page 8 of 12
Disclosure
1, 2. This hypothetical estimate of cost savings is calculated by multiplying the
difference in fees by the current contract value. This hypothetical estimate is for
the first year only and assumes a 0% rate of return and the difference in annuity
fees and expenses. It does not assume annual maintenance or surrender charges,
if applicable. This estimate is not intended to predict or project investment results
or future values. Annuity providers use different methods of calculating fees,
and therefore your actual cost savings value may be higher or lower than this
hypothetical estimate.
3. This analysis is based on information provided by the customer. Fidelity cannot
guarantee the accuracy of the information provided.
4. The AM Best ratings scale includes 16 different rating levels, in a range
including A++, A+ (Superior); A, A– (Excellent); B++, B+ (Very Good); B,
B– (Fair); C++, C+ (Marginal); C, C– (Weak); D (Poor); E (Under Regulatory
Supervision); F (In Liquidation); S (Rating Suspended). Best’s ratings ranging from
A++ down to B+ are considered secure. AM Best describes secure insurers as
having a strong or good ability to meet their long-term obligations to members
and policyholders. Insurers assigned secure ratings maintain a level of financial
strength that can withstand unfavorable changes in the business, economic, or
regulatory environment. Not Rated categories (NR) are assigned to companies
reported on by AM Best, but not assigned a Best’s Rating. The five categories and
descriptions are as follows: NR-1 (Insufficient Data); NR-2 (Insufficient Size and/
or Operating Experience); NR-3 (Rating Procedure Inapplicable); NR-4 (Company
Request); NR-5 (Not Formally Followed). Best’s ratings are not a warranty of an
insurer’s current or future ability to meet obligations to policyholders, nor are they
a recommendation of a specific policy form, contract, rate, or claim practice.
5. For contracts purchased with an initial purchase payment of $1,000,000
or more, the mortality and expense (M&E) risk charge is 0.05%. The M&E
for contracts funded with purchase payments from multiple sources will be
determined solely by the amount of the initial purchase payment that is applied to
the contract on the contract date.
This analysis of surrender charge versus the asset-based charge savings makes
several assumptions, including, but not necessarily limited to, all of the following (i–vi):
i. Gross market returns are assumed to be the same in either annuity.
ii. The only difference between the calculation of each annuity’s asset-based
charge is the percentage of the charge.
iii. It is assumed each contract is invested in an investment portfolio with an
average subaccount expense ratio that is equal to the average subaccount
expense ratio of all the subaccounts available within that contract. The only
exception to this is if the actual (for current contracts) or planned (for new
contracts) investment allocations were provided to the Fidelity representative. If
so, a weighted average subaccount expense ratio based on the actual or planned
investment portfolio is used.
iv. The existing deferred variable annuity is assumed to be invested entirely in
variable funds.
v. The total annuity charge of the existing contract may include charges for
benefits that are not provided by Fidelity Personal Retirement Annuity. The fee
savings calculation does not reflect any difference in benefits provided.
vi. The surrender value shown is assumed to be exchanged on the date this report
was produced — an exchange at a later date could produce a significant difference
in this analysis.
E
L
P
Hollow stars indicate that pre-inception return data was used to calculate the
subaccount’s star rating. Pre-inception returns are based on the oldest share
class of the underlying fund, and are adjusted to reflect the fees and expenses of
the share class available within the annuity, as well as the additional fees of the
annuity. Note: Once a share class has at least three years of actual history, preinception returns are no longer used to determine the subaccount’s overall rating;
instead, the respective class’s own rating(s) are used to calculate the overall rating.
M
A
S
6. Fund expenses: These expenses are deducted from funds’ assets, including
management fees, distribution and/or service (12b-1) fees, and other expenses.
7. The Fidelity Personal Retirement Annuity has no annual maintenance charge. For
the compared contract, it does not include the annual maintenance charge, if any.
8. Source: Morningstar, Inc., Chicago, IL. Morningstar rates investments from one
to five stars based on how well they’ve performed (after adjusting for risk and
accounting for all relevant sales charges) in comparison to similar investments.
Within each Morningstar Category, the top 10% of investments receive 5 stars,
the next 22.5% 4 stars, the middle 35% 3 stars, the next 22.5% 2 stars, and the
bottom 10% receive 1 star. Investments are rated for up to three time periods — 3, 5, and 10 years — and these ratings are combined to produce an overall
rating. Investments with less than three years of history are not rated. Ratings
are objective, based entirely on a mathematical evaluation of past performance.
They’re a useful tool for identifying investments worthy of further research, but
shouldn’t be considered buy or sell recommendations.
9. Source: Morningstar, Inc., Chicago, IL. Morningstar assigns categories to
all types of portfolios, such as mutual funds, variable annuities, and separate
accounts. Portfolios are placed in a given category based on their average
holdings statistics over the past three years. Morningstar’s editorial team also
reviews and approves all category assignments. If the portfolio is new and has no
history, Morningstar estimates where it will fall before giving it a more permanent
category assignment. When necessary, Morningstar may change a category
assignment based on recent changes to the portfolio.
Fidelity Investments Life Insurance Company is licensed in all states except
New York. In New York, Fidelity insurance products are issued by Empire
Fidelity Investments Life Insurance Company,® New York, N.Y. Products may
not be available in all states. The contract’s financial guarantees are solely the
responsibility of the issuing insurance company.
Diversification does not ensure a profit or guarantee against loss. Equity
investments involve more risk because their value will fluctuate according to their
performance. Bond prices rise when interest rates fall, and vice versa. This effect
is usually more pronounced for longer-term securities. Foreign investments involve
risks in addition to those of U.S. investments, including political and economic
risks, as well as risk of currency fluctuations. These risks may be magnified in
emerging markets. Investing in small-cap stocks may have greater risks because
they are subject to more abrupt or erratic price fluctuations.
This report is based on data from Morningstar, Inc., an independent third-party
data provider that is not affiliated with any Fidelity Investments company. Data
from Morningstar is considered to be reliable, but we cannot guarantee its
accuracy. The analysis should not be (nor is it intended to be) a substitute for
careful consideration by you of the features and services being compared. Before
determining whether a 1035 exchange from your existing annuity is appropriate
for you, please make sure you have properly considered all the advantages and
disadvantages of your existing annuity and the Fidelity annuity.
© 2011 Morningstar, Inc. All rights reserved. The information, data, analyses, and opinions contained herein (1) include the confidential and
proprietary information of Morningstar, (2) may not be copied or redistributed, (3) do not constitute investment advice offered by Morningstar,
(4) are provided solely for informational purposes and therefore are not an offer to buy or sell a security, and (5) are not warranted to be correct,
complete, or accurate. Except as otherwise required by law, Morningstar shall not be responsible for any trading decisions, damages, or other
losses resulting from, or related to, this information, data, analyses, or opinions, or their use.
120032_01_MSC_Retail_ACCR.indd 8
1/9/12 12:55 PM
Release date 11-30-2011
Page 9 of 12
Disclosure
Before exchanging, check with your current provider to see if it will
assess a surrender charge. Also consider the existing benefits and
features you may lose in an exchange.
Information identified as unavailable in this report should be obtained
by contacting your current annuity provider and considered before you
decide to exchange your annuity. Principal value and investment returns
of a variable annuity will fluctuate and you may have a gain or loss when
money is withdrawn.
Withdrawals of taxable amounts from an annuity are subject to ordinary
income tax, and, if taken before age 59½, may be subject to a 10% IRS
penalty.
VIP refers to Variable Insurance Product.
Fidelity Personal Retirement Annuity® (Policy Form No. DVA-2005, et al.) is issued
by Fidelity Investments Life Insurance Company and, in New York, Personal
Retirement Annuity (Policy Form No. EDVA-2005, et al.) is issued by Empire Fidelity
Investments Life Insurance Company,® New York, NY.
Before investing, consider the investment objectives, risks,
charges, and expenses of the fund or annuity and its investment
options. Call or write to Fidelity or visit Fidelity.com for a free
prospectus and, if available, summary prospectus containing this
information. Read it carefully.
E
L
P
M
A
S
© 2011 Morningstar, Inc. All rights reserved. The information, data, analyses, and opinions contained herein (1) include the confidential and
proprietary information of Morningstar, (2) may not be copied or redistributed, (3) do not constitute investment advice offered by Morningstar,
(4) are provided solely for informational purposes and therefore are not an offer to buy or sell a security, and (5) are not warranted to be correct,
complete, or accurate. Except as otherwise required by law, Morningstar shall not be responsible for any trading decisions, damages, or other
losses resulting from, or related to, this information, data, analyses, or opinions, or their use.
120032_01_MSC_Retail_ACCR.indd 9
1/9/12 12:55 PM
E
L
P
M
A
S
This page intentionally left blank.
120032_01_MSC_Retail_ACCR.indd 10
1/9/12 12:55 PM
E
L
P
M
A
S
This page intentionally left blank.
120032_01_MSC_Retail_ACCR.indd 11
1/9/12 12:55 PM
E
L
P
M
A
S
ACCR-SRPT-RET
553177.2.01.915272.101
120032_01_MSC_Retail_ACCR.indd 12
1/9/12 12:55 PM

