DATA TABLE 1: Resting Heart rate Hypothesis Independent Variab
advertisement
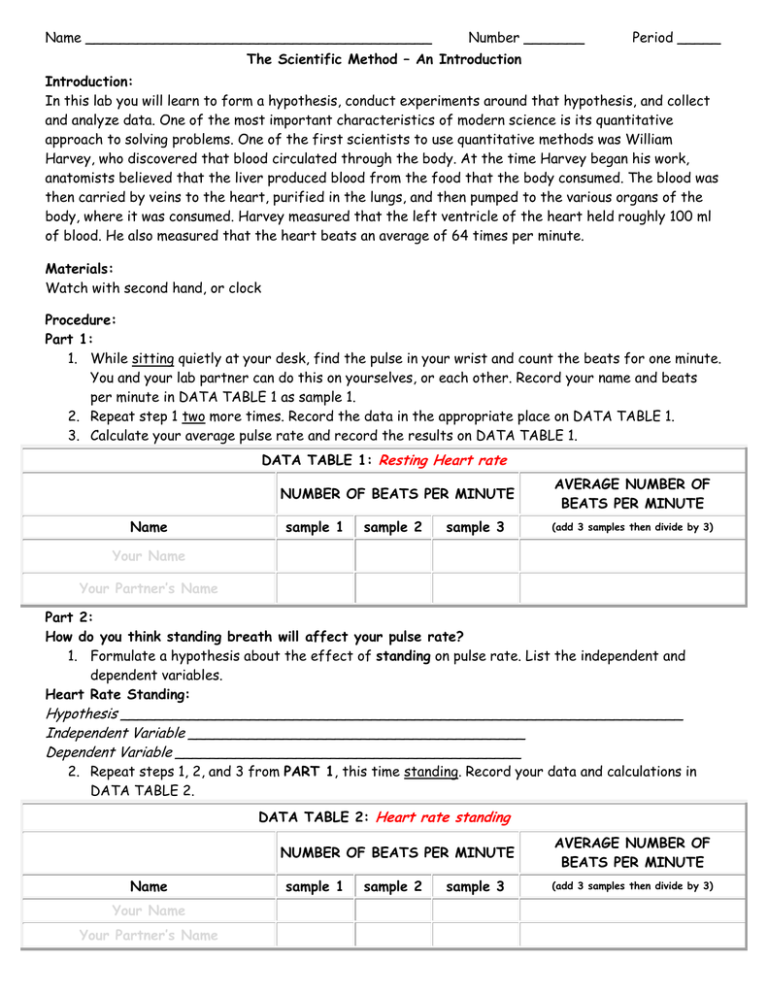
Name ________________________________________ Number _______ Period _____ The Scientific Method – An Introduction Introduction: In this lab you will learn to form a hypothesis, conduct experiments around that hypothesis, and collect and analyze data. One of the most important characteristics of modern science is its quantitative approach to solving problems. One of the first scientists to use quantitative methods was William Harvey, who discovered that blood circulated through the body. At the time Harvey began his work, anatomists believed that the liver produced blood from the food that the body consumed. The blood was then carried by veins to the heart, purified in the lungs, and then pumped to the various organs of the body, where it was consumed. Harvey measured that the left ventricle of the heart held roughly 100 ml of blood. He also measured that the heart beats an average of 64 times per minute. Materials: Watch with second hand, or clock Procedure: Part 1: 1. While sitting quietly at your desk, find the pulse in your wrist and count the beats for one minute. You and your lab partner can do this on yourselves, or each other. Record your name and beats per minute in DATA TABLE 1 as sample 1. 2. Repeat step 1 two more times. Record the data in the appropriate place on DATA TABLE 1. 3. Calculate your average pulse rate and record the results on DATA TABLE 1. DATA TABLE 1: Resting Heart rate NUMBER OF BEATS PER MINUTE Name sample 1 sample 2 sample 3 AVERAGE NUMBER OF BEATS PER MINUTE (add 3 samples then divide by 3) Your Name Your Partner’s Name Part 2: How do you think standing breath will affect your pulse rate? 1. Formulate a hypothesis about the effect of standing on pulse rate. List the independent and dependent variables. Heart Rate Standing: Hypothesis _________________________________________________________________ Independent Variable _______________________________________ Dependent Variable ________________________________________ 2. Repeat steps 1, 2, and 3 from PART 1, this time standing. Record your data and calculations in DATA TABLE 2. DATA TABLE 2: Heart rate standing NUMBER OF BEATS PER MINUTE Name Your Name Your Partner’s Name sample 1 sample 2 sample 3 AVERAGE NUMBER OF BEATS PER MINUTE (add 3 samples then divide by 3) Part 3: How do you think holding your breath will affect your pulse rate? 1. Formulate a hypothesis about the effect of holding your breath on pulse rate. List the independent and dependent variables. Heart Rate While Holding Your Breath: Hypothesis _________________________________________________________________ Independent Variable _______________________________________ Dependent Variable ________________________________________ 2. Repeat steps 1, 2, and 3 from PART 1, this time holding your breath (NOTE: You will be sitting while doing this – remember, it’s a controlled experiment). Record your data and calculations in the DATA TABLE 3. DATA TABLE 3: Heart rate holding breath NUMBER OF BEATS PER MINUTE Name sample 1 sample 2 sample 3 AVERAGE NUMBER OF BEATS PER MINUTE (add 3 samples then divide by 3) Your Name Your Partner’s Name Conclusion: Compare your data. 1. How do your results in Parts 2 & 3 (standing and holding your breath) compare with the hypothesis you made for each condition? Standing: ___________________________________________________________________________________________ ___________________________________________________________________________________________ Holding Breath: ___________________________________________________________________________________________ ___________________________________________________________________________________________ 2. What is the control group in this investigation? _________________________________________________________________________ 3. What are some possible sources of error in this experiment (why might your results be biased or not quite right)? _________________________________________________________________________ _________________________________________________________________________ _________________________________________________________________________ _________________________________________________________________________ 4. Create a bar graph (on a sheet of graph paper) that shows the average beats per minute for your heart rate and your partner’s while resting, standing, and holding your breath. Make sure you label each axis, give your graph a title, and label each bar. REMEMBER: Graphs should be as large as possible – use all the available space!
