ESTIMATING ANIMALS: MArk-rEcApTurE
advertisement

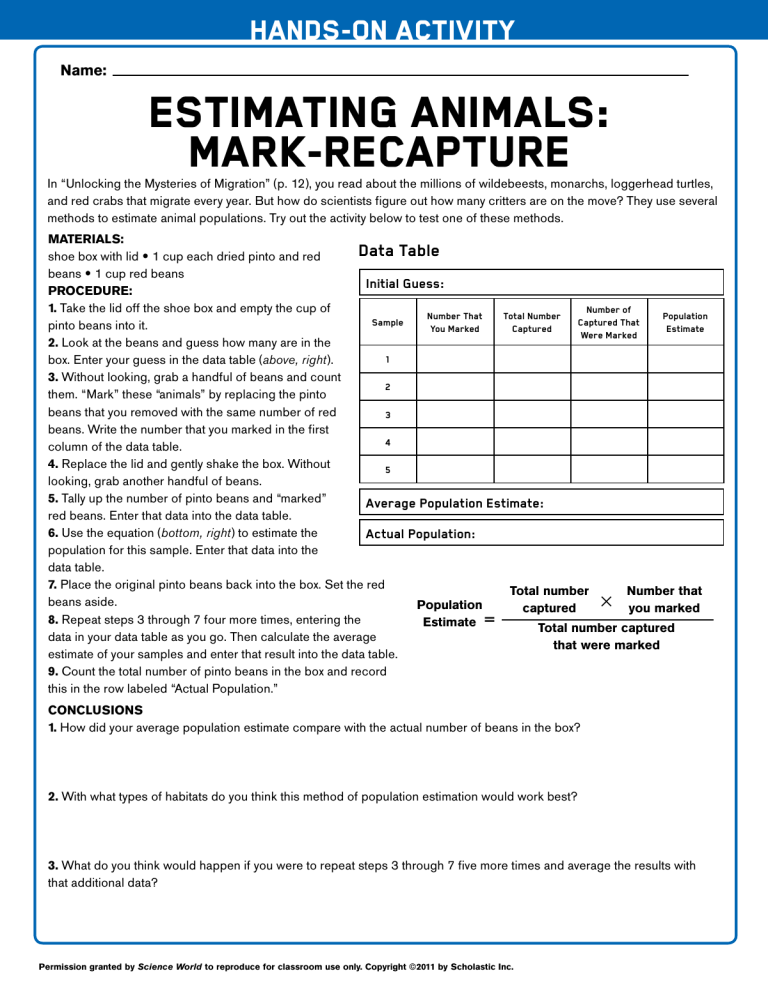
HANDS-ON ACTIVITY Name: ESTIMATING ANIMALS: Mark-Recapture In “Unlocking the Mysteries of Migration” (p. 12), you read about the millions of wildebeests, monarchs, loggerhead turtles, and red crabs that migrate every year. But how do scientists figure out how many critters are on the move? They use several methods to estimate animal populations. Try out the activity below to test one of these methods. Materials: Data Table shoe box with lid • 1 cup each dried pinto and red beans • 1 cup red beans Initial Guess: PROCEDURE: 1. Take the lid off the shoe box and empty the cup of Number of Number That Total Number Population Sample Captured That pinto beans into it. You Marked Captured Estimate Were Marked 2. Look at the beans and guess how many are in the 1 box. Enter your guess in the data table (above, right). 3. Without looking, grab a handful of beans and count 2 them. “Mark” these “animals” by replacing the pinto beans that you removed with the same number of red 3 beans. Write the number that you marked in the first 4 column of the data table. 4. Replace the lid and gently shake the box. Without 5 looking, grab another handful of beans. 5. Tally up the number of pinto beans and “marked” Average Population Estimate: red beans. Enter that data into the data table. 6. Use the equation (bottom, right) to estimate the Actual Population: population for this sample. Enter that data into the data table. 7. Place the original pinto beans back into the box. Set the red Total number Number that beans aside. 5 Population captured you marked 8. Repeat steps 3 through 7 four more times, entering the Estimate = Total number captured data in your data table as you go. Then calculate the average that were marked estimate of your samples and enter that result into the data table. 9. Count the total number of pinto beans in the box and record this in the row labeled “Actual Population.” CONCLUSIONS 1. How did your average population estimate compare with the actual number of beans in the box? 2. With what types of habitats do you think this method of population estimation would work best? 3. What do you think would happen if you were to repeat steps 3 through 7 five more times and average the results with that additional data? Permission granted by Science World to reproduce for classroom use only. Copyright ©2011 by Scholastic Inc.


