A simulation model for data base system performance evaluation
advertisement
A simulation mo·del for data base system
performance evaluation
by FUMIO NAKAMURA, IKUZO YOSHIDA and HIDEFUMI KONDO
Hitachi Limited
Yokohama, Japan
SIMULATION MODEL
INTRODUCTION
The simulation model written by using a computer system
simulation package has two major portions, definition part
and procedure part. The definition part describes the system
environment being simulated, while the procedure part
represents the software system using an instruction set
prepared by the simulator. The simulator executes instructions in the procedure part interpretively referencing information in the definition part.
Our model consists of the following components.
Performance evaluation represents one of the most critical
and also most complex aspects of the design of a data base
system for operation in an on-line environment.
l\1ost techniques for computer system evaluation (such as
software and hardware monitoring) presume that the system
or at least a skeletal version of it is operational. Such techniques are useful primarily for turning already developed
systems.
Simulation, on the other hand, although it is expensive,
offers a way to evaluate a system with relative accuracy
prior to its development. By varying design parameters, the
system designer can hope to identify potential bottlenecks,
avoid costly design mistakes, and eliminate some of the
guess work of identifying the most suitable system solution.
The subject of this paper is a large scale simulation model
which was developed for data base system performance
evaluation. The model, which is used for evaluation of
design alternatives for application systems as well as system
software (OS (Operating System) and DBMS (Data Base
Management System)), employs event-driven simulation of
the actual operations of hardware, host operating system,
DBMS, and application programs.
Great care was taken to model OS and DBMS functions,
such as task scheduling, I/O interrupt processing, communication processing, message scheduling, data base access
processing, buffer management, and disk space management
independent of any application characteristics.
In order to evaluate an application data base system,
description of hardware configuration and data base characteristics, as well as application program models, must be
prepared. l\1odifications of the actual model are required only
if alternative OS and/or DBMS architectures are being
examined.
Once the user has developed a model of his system, its
behavior can be evaluated with relative ease, by simply
modifying parameters such as message traffic, data base
buffer set size, number of concurrent application program
tasks, data base organization, and disk storage allocation.
The remainder of this paper gives a presentation of the
model, discusses some simulation results, and outlines
approaches for further development.
Definition Part
(1) Hardware description
(2) Application description
Procedure Part
(3) Operating system model
(4) Data base management system (DBMS) model
(5) Application program models
For an application system, (1), (2) and (5) must be
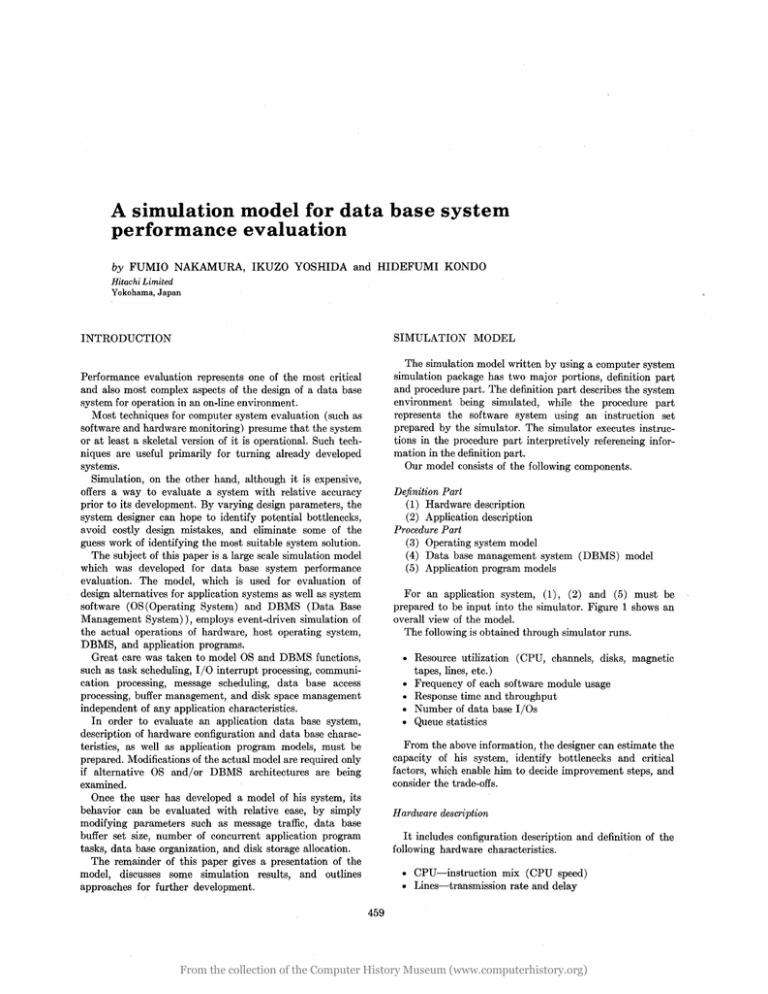
prepared to be input into the simulator. Figure 1 shows an
overall view of the model.
The following is obtained through simulator runs.
• Resource utilization (CPU, channels, disks, magnetic
tapes, lines, etc.)
• Frequency of each software module usage
• Response time and throughput
• Number of data base l/Os
• Queue statistics
From the above information, the designer can estimate the
capacity of his system, identify bottlenecks and critical
factors, which enable him to decide improvement steps, and
consider the trade-offs.
Hardware description
It includes configuration description and definition of the
following hardware characteristics.
• CPU-instruction mix (CPU speed)
• Lines-transmission rate and delay
459
From the collection of the Computer History Museum (www.computerhistory.org)
460
National Computer Conference, 1975
Terminal
Queues
~----------------------l
I
t---+--I
f------t"-...
I
I
I
I
I
I
Communication Support
I
I
Input
Message
Queue
Ready
Queue
Task
Schedule
Wait
Queue
Output
I
Message I
Queue
:
I/O Interrupt
Routines
L _____________ ,
, ________ J
Communication
Processor
Message
Scheduler
I/O
~
~
Message
Buffers
Scheduling
Queue
Buffer
Manager
Access
Methods
Data Access t-----~
Service
Disk Space
Manager
Application
Programs
(~s?)
I
L ______________________________________________ J.
Figure I-Overall view of simulation model
• Terminals-message generation rate and distribution
• Channels-data transfer rate and channel interference
rate
• Disks-data transfer rate, cycle time, seek time
characteristics and RPS (Rotational Position
Sensing) lead and hold time
• Magnetic tapes-data transfer rate and start time
A pplication description
The most important information here is the data base
definition characterized by data structures, storage structures
and access methods. Figure 2, Table I and Table II show how
we are dealing with data base definition in the model.
(1) Data structures-The DBMS supports hierarchical
data structures, composed of an aggregate of elements
Data Base
Definition Tables
~
called segments. Each segment has one parent segment
except a root segment and any number of child segments. Item 6 to the last in Table I describe a data
structure.
(2) Storage structures-Item 2 and 5 in Table I and item
2 to 7 in Table II are concerned with a storage
structure which, due to its nature, cannot be easily
represented in a model; that is, there may be tens of
thousands of records or millions of records and a
model can never keep the exact position of each
record except environmental information such as disk
type, block length, and file allocation on secondary
storage. The only information related to the above
problem is the segment overflow ratio in Table I and
this information and some additional data base access
calls will make up for the problem. (See DBMS model)
(3) Access methods-The DB]\tIS supports, as basic access
methods, Sequential Access Method (SAM), Indexed
Sequential Access Method (ISAM) and Direct Access
Method (DAM).
Operating system model
Excluding comments, 400 simulator instructions were
required to model the following operating system functions.
File Definition
Tables
Figure 2-Table relationships in data base definition
(1) Task scheduler-A data base system in an on-line
environment is executed in multi-programming and/or
From the collection of the Computer History Museum (www.computerhistory.org)
A Simulation Model for Data Base System Performance Evaluation
TABLE I-Data Base Definition Table
No.
461
munication processor and the data access processor, is the
most important part in the model.
CONTENTS
(1) Main controller-This component manages the whole
Data Base Name
2
Disk Type to Store Data Base
3
Pointer for FDT 1
4
Pointer for FDT 2
5
Segment Overflow Ratio
6
Number of Segments in Data Base
7
Segment Name
8
Segment Length
9
Segment Level in Hierarchy
10
Parent Segment Name
11
Occurrence under Parent Segment
Repeat 7 '" 11 until Last Segment
multi-tasking modes, which requires a module for task
management. This module attaches and detaches
tasks to the DBMS and application programs,
maintains ready and wait queues, and activates and
inactivates tasks according to their priorities.
(2) Communication support-This component manages
communication lines and terminals, controls polling,
sends and receives messages and services message I/O
completion interrupts. A productive poll which
follows message transmission occurs when a terminal
generates a message. After message transmission has
completed, the message is put into the input message
queue. An output message in the output message
queue, on the other hand, is sent to a terminal, which
causes an output transmission completion interrupt
that restarts polling.
(3) I/O interrupt service routines-The model has I/O
interrupt routines according to I/O device types which
involve magnetic tapes (for log data), HITAC
8578 Disk Storage (cycle time 25 ms, average seek
time 60 ms, capacity 29 MB) and HITAC 8589
Disk Storage (cycle time 16.7 ms, average seek time
30 ms, capacity 100 MB). Completion of read, write
and seek gives control to these routines.
DBMS model
Two thousand three hundred statements are used to model
this part which, consisting of the main controller, the com-
DBMS, which means that it gathers log information,
controls the status of the data base system, schedules
messages and communicates with and controls messages. It gives control to the communication processor
when an input message arrives. After communication
processor's service, it schedules the message according
to the priority and activates an application program.
A data access call from an application program makes
it give control to the data access.
(2) Communication processor-It services input and
output messages under communication support in the
operating system and gets control when, (a) communication support completes message input and
output, and (b) a message to send exists. It moves an
input message from the input message queue to the
scheduling queue and makes a copy on a disk at the
same time. Transmission completion service of an
output message causes it to issue a request to restart
polling to communication support. When a message
is in the output message queue, it issues a command
to send out the message to communication support.
(3) Data access-It is activated by a data access call from
an application program. Its major modules are service
routines for data access calls, i.e., retrieve, insert,
replace and delete, buffer and disk space management
modules, and modules to support access methods
(SAM, ISAM, DAM). The model supports a set of
primitive data access call functions including Get
Random, Get Random Next, Get Immediate Next,
Get Link, Insert Random, Insert Immediate Next,
Replace and Delete. For example, Get Random
selects a record randomly among all data base records
given by data base definition, determines the physical
address, and accesses it; Get Random Next calculates
the distance, within a record, between the segment
TABLE II--,-File Definition Table
No.
CONTENTS
Access Method
2
Start Address in Disk Number
3
Start Address in Cylinder Number
4
N umber of Blocks Allocated
5
Block Length
6
N umber of Blocks per Track
7
Logical Record Length
From the collection of the Computer History Museum (www.computerhistory.org)
462
National Computer Conference, 1975
Example:
Process
DA
CTR=5
A Process
DA
Data Base
I/O Requests
Buffer Management
Module
Buffer Set
200 (instruction steps)
GR, DBI, SG1 (GR: Get Random)
100
GRN, DB1, SG2 (GIN: Get
Immediate Next)
CTR=CTR-l
Access
Methods
Reference
chain
If
CTR~O
Go To A
EXAMPLES OF SIMULATION
,
\
\
L/
,,
Buffer Address in Buffer Set
H ardware configuration-Insurance company
Information
attached to
buffer
Buffer Size
Data Base Name
b~r:~~:ddress in
Buffer Empty Flag
Buffer Busy Flag
Write Identifier
Reference Chain
Figure 4 shows all equipment components, some of which
(the console typewriter, card readers, line printers and most
magnetic tapes) are not necessary for simulation.
The central processing unit (CPU) has a 0.1J,L second
machine cycle time, a 0.9J,L second memory cycle time and
16K byte high speed buffer memory and supports four-way
interleave.
We decided on a CPU speed of 1.6J,L seconds per instruction
which was gotten by the other project.
There exists no channel interference as the I/O processor
processes all data I/Os.
Figure 3-Buffer management position and buffer information
to be obtained and the one accessed before based on
the hierarchical structure of the data base and each
segment's occurrence and gets it; Get Immediate Next
brings the next segment immediately after the current
segment; Get Link issues one random physical read
to the specified data base.
The LRU (Least Recently Used) method is used in
the buffer management module which is one of the
most important modules in the DBMS model. All
data base I/O requests are processed through this
. module. Figure 3 illustrates the position of buffer
management and information attached to each buffer
for its manipulation of the buffer set. Buffers in the
buffer set are chained by reference chain. At the time
of data base access the buffer management module
searches the buffer set at first by tracing this chain, and
if the required data don't exist in the buffer set it
tries to get buffer space to read the data from disk
storage by tracing the chain backwards. The module
also .controls concurrent data base access.
A pplication program model
User application programs are modeled in this part. The
model mainly involves CPU steps spent in application programs, control of the process and data access calls with the
following format:
DA call function, data base name, segment name
• Forty (40) disk storage devices are connected with 6
control units and 2 block multiplexor channels and have
30 millisecond average seek time, 16.7 millisecond cycle
time, a data transfer rate of 800K bytes per second, and
a 100 million byte capacity per spindle. The model also
simulates RPS (Rotational Position Sensing) action.
• Only one or two magnetic tapes for logging are necessary
to simulate the system because simultaneous background
jobs are left out of consideration. The tapes have a data
transfer rate of 240K bytes per second and 3 millisecond
start time.
• There are 250 terminals connected with 30 lines with a
speed of 1200 bits per second. Message length is within
a range of 30 to 800 bytes. Poisson arrival of messages is
assumed.
Data bases-Insurance company
Eleven data bases, most of them constructed by ISAM
and DAM combinations, are contained in the system and
have totally about 6 million records which occupy 32 disk
packs. The data structures are not so complex, however, as
their hierarchical levels are two or three. The largest data
base is the car insurance data base which has 1.3 million
records and requires 9 disk packs. ISAM files have four kinds
of indexes, super index, master index, cylinder index and
block index, where super and master indexes are always in
core and also cylinder indexes in some cases. All data bases
have the same block size of 2400 bytes which allows for five
blocks per track.
From the collection of the Computer History Museum (www.computerhistory.org)
A Simulation Model for Data Base System Performance Evaluation
*
It includes 20 percent
not in buffer ratio
H8700 CPU
1.6* Jls/inst.
(MM 1.5 MB)
463
H8589 Disk Storage
AV. Seek Time: 30 ms
)
Cycle Time : 16.7 ms
( Data Transfer: 800 KB/sec.
lOP
MPX
Console
----{j
---{j
---{j
---{j
Traffic: 10000 Msg/hr
250 Terminals
30 Lines
1200 bps
I
8 Spindles
8 Spindles
4 Spindles
8 Spindles
--{j
---{j
I
:: 14 decks
6
H8455 Magnetic
8 Spindles
4 Spindles
Tape System (240 KB/ sec)
Figure 4-Hardware configuration
Application programs-Insurance company
The system employs 60 different application programs
which can be classified into four categories. The first covers
inquiry services, the second is registration of a new contract
and its document issue, the third is continuance of a contract,
and the last is the update of a contract. All categories but
the first one require data base updates. New contract processing takes a particularly long time on account of many
data base access calls (more than ten get, insert and replace
calls) to four or five data bases. Five partitions where application programs run are reserved in the model, which means
that a maximum of five application programs are simultaneously executed.
Results-Insurance company
We simulated 15 production runs with different message
traffic, message scheduling strategies (concurrent DB access
checks), application programs and number of partitions for
application programs. Three results selected among those
provided by these runs are shown in Table III. Result 1
based on the system environment explained above tells that
the system failed to process the traffic of 10000 messages per
hour (response time, its standard distribution and current
contents of scheduling queue). The causes are neither hardware equipment bottlenecks (CPU, channel and disk
utilizations) nor a task bottleneck (number of concurrent
TABLE III-Simulation Results
2
3
9500
9600
15200
7.8
1.0
1.6
Standard Deviation of Response Time
(sec.)
19.9
0.84
2.1
CPU Utilization (%)
31.0
26.0
38.6
5.6
5.1
7.5
Max. Disk Utilization (%)
28.5
26.4
40.0
Average Number of DB l/Os (jTrans.)
10.5
6.2
5.2
Message Traffic (Msg./hr.)
Average Response Time (sec.)
Max. Channel Utilization (%)
Current Contents of Scheduling Queue
(Trans.)
Average Number of Concurrent AP
Tasks
o
131
2.2
1.8
2.5
Clock Value in the Model (sec.)
438
573
393
Simulation Time (min.)
220
220
220
From the collection of the Computer History Museum (www.computerhistory.org)
464
National Computer Conference, 1975
AP tasks) because there can exist five application program
tasks at a time. The real bottlenGck lay in the area of concurrent data base updates. All application programs except
inquiry services issue data base update calls and if they are
going to update the same data bases, only the message which
has the highest priority is scheduled, while other messages
remain in the scheduling queue· even if all other partitions
are empty. In this case, application programs of three categories update the same data bases, and the new contract
processing has the highest priority and the heaviest load of
all as mentioned before and accounts for a quarter of the
message traffic, Which means that messages belonging to the
other two categories can hardly be scheduled. Actually we
found, by checking the scheduling queue, that these messages
had waited over 70 seconds there when the simulation stopped.
We suggested to the system designers to eliminate on-line
updates in the new contract processing and to maintain data
bases in batch mode or batch message processing mode.
Result 2 shows how the new contract processing without data
base updates improved the response time. There is no performance problem at all in Result 2. Result 3 tells that the
modified system can easily bear the traffic of 15000 messages
per hour.
Number of physical
data base l/Os
30
]
20
Type of APs : Inquiry
Number of concurrent AP tasks: 5
Data base block size: 3500 bytes
Type of APs : Inquiry
Number of concurrent AP tasks : 5
Traffic : 5000 messages/hr.
41/0s
.B
....0
20
i:iQl
0
~
<l>
Il.
10
0+-~~--~~--~~------4-------4------
o
4
Response time (sec.)
Figure 6-Response time distribution (1)
data base records. Figure 5 tells that
• buffer set size hardly affects the response time with low
message traffic,
• more buffers are required as message traffic goes up,
buffer requirement becomes saturated, however, and
further buffers don't shorten the response time.
Other results
The following simulation results were obtained in a different system environment, which will not be explained in detail
here.
Figure 5 shows the relationship between data base buffer
set sizes and the response time with message traffic as a
parameter. The number of concurrent application program
tasks is five, the block size of data bases is 3500 bytes, and
application programs retrieve a record randomly among all
21/0 s
The dotted line in the figure shows the minimum buffer set
size required at each value of message traffic and we can see
the necessary and sufficient buffer set size to contribute to the
system throughput is 17500 bytes which can contain five
data base blocks, the same number as concurrent application
program tasks.
This is caused by the facts that a required record seldom
exists in the buffer set because of random retrieval and the
retrieval process needs one buffer at a time.
Response time distribution with the number of data base
l/Os as a parameter is plotted in Figure 6. The effect of the
number of data base l/Os on response time distribution is
dramatic. Figure 7 shows the response time distribution with
physical block lengths of data bases, as a parameter, comparing the same block length with two kinds of block lengths in
15
Traffic: 14000 messages/hr.
Number of concurrent AP tasks :
0
Ql
10
rn
.~
/
10
~
Traffic
"~
0
17200 Msg./hr.
3
.8
....0
...,
Ql
~
Ql
QJ)
DB block sizes: 3500 and 2000 bytes
Average response time: 4.82 sec.
=
oj
~
Ql
/
Q)
(J
...:>
DB block size: 3500 byte's
Average response time: 2.45 sec .
!-t
Q)
14000 Msg./hr.
Il.
~g88 ~~~Jg~:
0
0
0
14
21
data base buffer set size (K bytes)
Figure 5-DB buffer set size vs. response time
0
2
4
6
7
8
Response time (sec.)
Figure 7-Response time distribution (2)
From the collection of the Computer History Museum (www.computerhistory.org)
A Simulation Model for Data Base System Performance Evaluation
15
/
3
DB block size: 3500 bytes
Average response time: 1.49 sec.
DB block sizes: 3500 and 2000 bytes
Average response time: 1.64 sec .
.8 10
'0
0:Q)
()
1-<
Q)
Traffic: 9200 messages/hr.
Number of concurrent AP tasks: 5
p.,
o+------L~-----+------~---­
o
Response time (sec.)
Figure 8-Response time distribution (3)
465
or fixed head disks-movable head disks) vs. system
throughput
We have collected and will collect the following data for
tuning of the model.
(a) Measurement of CPU dynamic steps and module
activity by an instruction tracer.
(b) Measurement of CPU, channels and disk storage
devices activities by a hardware monitor. It includes
data as described below in batch and on-line environment.
• CPU active time, CPU active and supervisor state time
• Process steps, process steps in supervisor state
• Number of supervisor calls issued
• Channel busy time
the same system environment. Avera; ; response time in the
case of two kinds of block sizes becL1ffies twice the one in
case of the same block size, and the same trend exists for the
deviation. The reason is that the buffer management module
has the common buffer set for all data bases and manages it
dynamically. More than one block size causes core frag~en­
tation and frequent requirements for garbage collectlOn,
which in turn increases the internal task wait time in the
buffer management module.
The effect becomes remarkable as the number of requests
for buffer management increases with· higher message traffic
and/or frequency of data base I/O requests per meassage.
Figure 8 which curves were obtained under the same environment as Figure 7 except message traffic demonstrates this.
We can see from the figure that there is no big difference
between the two results when the message traffic is 9200
messages per hour.
CONCLUSION
A simulation model which uses an event-driven type simulator was developed for the purpose of performance prediction
of data base systems and research in the field of data base
management system architecture. Several areas in which the
model has been and is currently being used are as follows.
• Performance evaluation of an on-line design information
system of a manufacturing company
• Evaluation of design alternatives of an on-line data
base system in an insurance company
• Simulation of buffer management characteristics
• Simulation of concurrent processing
• Memory hierarchy of data bases (main memory-drum
• Disk seek time and count, search/read time and count,
write time and count, RPS time and count.
We finished measuring them, finished analyzing the results
in batch environment and are currently analyzing the results
in on-line environment. The model is reasonably accurate in
batch environment.
As this model uses an event-driven type simulator, real
time/simulated time ratio is generally high (i.e., simulation
cost is high). The value of that ratio depends upon the
density of events (message traffic, number of data base access calls, etc.). From our experiment, the value is between
20 and 100.
ACKNOWLEDGMENTS
The authors wish to express their grateful thanks to Mr. S.
Mimura and Mr. H. Sakai of the Software Works for providing us the opportunity of this research. We 91so would like
to thank Mr. K. Arai and Mr. Y. Kasai for their suggestion
and support concerning the simulation package.
REFERENCES
1. Senko, M. E., E. B. Altman, M. M. Astrahan, and P. L. Fehder,
"Data Structures and Accessing in Data-Base Systems," IBM
Systems Journal, No.1, 1973.
2. Collmeyer, A. J. and J. E. Shemer, "Analysis of Retrieval Performance for Selected File Organization Techniques," Proceedings of the
Fall Joint Computer Conference, 1970.
3. Stimler, S. and K. A. Brons, "A Methodology for Calculating and
Optimizing Real-Time System Performance," Comm. of the ACM,
Vol. 11, No.7, 1968.
4. Lum, V. Y., H. Ling, and M. E. Senko, "Analysis of a Complex
Data Management Access Method by Simulation Modeling,"
Proceedings of the Fall Joint Computer Conference, 1970.
From the collection of the Computer History Museum (www.computerhistory.org)
From the collection of the Computer History Museum (www.computerhistory.org)

