Insights
Fight or flight: thoughts on
recent market volatility
RSVP
In October of 2014, investors were
tested as fears of the Ebola virus,
weak global economic growth
and heightened geopolitical
tensions sent stocks sharply lower.
Most of the time stocks tend to rise as the economy grows;
the historical average total return for US stocks has been
10%. A basic optimism has generally served equity investors
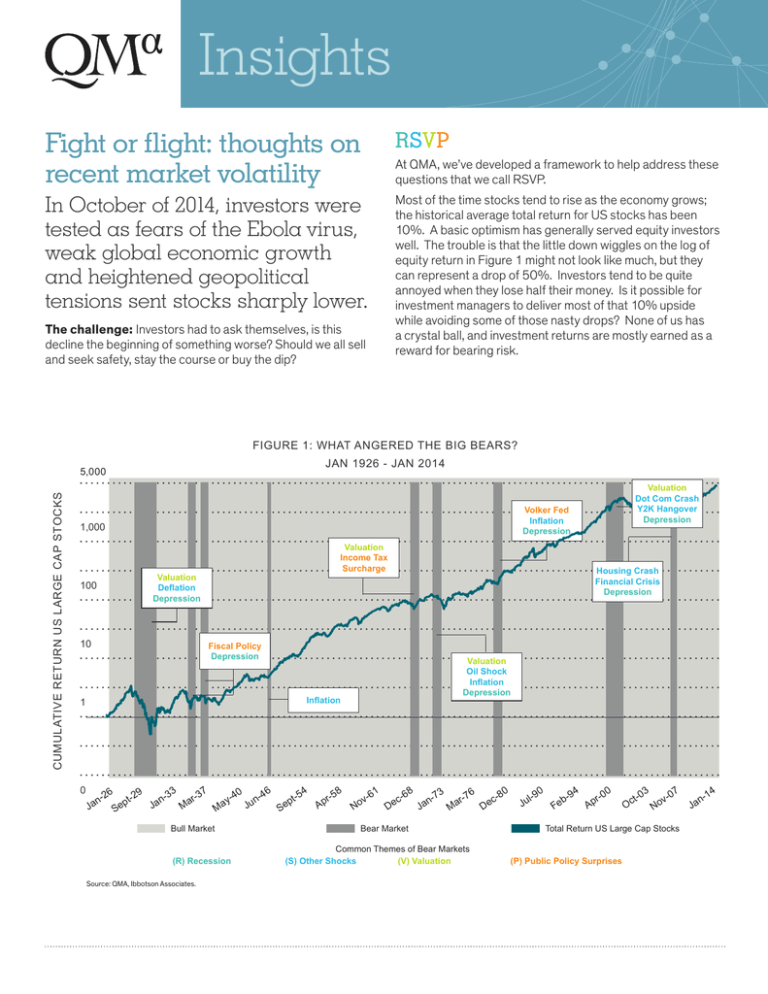
well. The trouble is that the little down wiggles on the log of
equity return in Figure 1 might not look like much, but they
can represent a drop of 50%. Investors tend to be quite
annoyed when they lose half their money. Is it possible for
investment managers to deliver most of that 10% upside
while avoiding some of those nasty drops? None of us has
a crystal ball, and investment returns are mostly earned as a
reward for bearing risk.
At QMA, we’ve developed a framework to help address these
questions that we call RSVP.
The challenge: Investors had to ask themselves, is this
decline the beginning of something worse? Should we all sell
and seek safety, stay the course or buy the dip?
FIGURE 1: WHAT ANGERED THE BIG BEARS?
JAN 1926 - JAN 2014
CUMULATIVE RETURN US LARGE CAP STOCKS
5,000
Volker Fed
Inflation
Depression
1,000
Valuation
Income Tax
Surcharge
Valuation
Deflation
Depression
100
10
Housing Crash
Financial Crisis
Depression
Fiscal Policy
Depression
Valuation
Oil Shock
Inflation
Depression
Inflation
1
0
26
n-
Ja
Valuation
Dot Com Crash
Y2K Hangover
Depression
9
t-2
p
Se
33
n-
Ja
7
r-3
Ma
Bull Market
(R) Recession
Source: QMA, Ibbotson Associates.
0
y-4
Ma
46
n-
Ju
54
pt-
Se
8
r-5
Ap
1
v-6
No
8
c-6
De
73
n-
Ja
6
r-7
Ma
Bear Market
Common Themes of Bear Markets
(S) Other Shocks
(V) Valuation
0
c-8
De
0
l-9
Ju
94
b-
Fe
0
r-0
Ap
3
t-0
Oc
7
v-0
No
Total Return US Large Cap Stocks
(P) Public Policy Surprises
14
n-
Ja
2INSIGHTS
OR FLIGHT
INSIGHTS THE FIGHT
DRAWDOWN
DILEMMA
What might cause the next bear
market?
We looked at what we believe to have been the proximate causes of
the prolonged bear markets since 1926, and we have categorized
them as either: Recession, Shocks, Valuation and Public Policy
Surprises—or RSVP.
Recession – Recessions are often associated with bear markets,
most dramatically during the Great Depression. Most recently, the
Great Recession of 2008-2009 certainly contributed to the bear
market.
Shocks – Shocks of various types (including the housing crash
and financial panic) have often contributed to bear markets,
for example the OPEC embargo and huge oil price increases of
1973-1974 and 1979. By definition, however, shocks are tough
to predict. War, terrorist attacks, a natural disaster, or some other
event might turn out to be the driver of the next bear market, and
investors need to be alert to every possibility.
Valuation – When valuations are higher than normal, the market
becomes quite vulnerable to bad news or shocks. Alan Greenspan
warned of possible “irrational exuberance” in 1996, but the market
would move much higher for nearly four more years before it
crashed. Valuation is not a precise market timing tool, but it is a
useful investment tool. Very high valuations have often preceded
bear markets.
Public Policy Surprises – Sudden changes in fiscal or
monetary policy can have a profound impact on the markets.
Perhaps the most dramatic such change in the past few decades
was the decision by the Volker Fed to raise rates to record levels in
the early 1980s as a way to crush inflation. The policy eventually
worked, and many believe that it helped set the stage for the multidecade bull markets in stocks and bonds that followed—but not
before precipitating a nasty bear market in the short term.
Applying RSVP in real time
So how did we apply this framework in October of 2014? By
October 15, the stock market had fallen over 7% from its peak.
Some thought that the long-awaited and oft-predicted correction
was underway; or perhaps the correction would spiral down to a
full-fledged bear market (e.g. a potential 20% or greater decline
from the peak and negative returns over a 12-month period). At
QMA, we asked ourselves whether the success of our bullish stance
of recent years had made us complacent, whether it was time to pull
back and take some risk off the table. To address this, we applied
the RSVP framework we had developed at the beginning of the
year:
Author
Ed Keon, Managing Director and Portfolio Manager,
QMA’s Asset Allocation Investment Team
For more information
To learn more about QMA’s asset allocation capabilities, please
contact Stephen Brundage, Managing Director and Product
Specialist, at Stephen.Brundage@qmassociates.com or
973.367.4591.
Recession – We thought it quite unlikely that the U.S. would enter
a recession in 2014 or 2015. All the data we considered indicated
that growth in the 3% range was likely to continue for several more
quarters. True, Europe was probably close to recession, but U.S.
exports to Europe represent only about 1% of U.S. GDP. Global
growth has slowed, but still seemed to be running about 3% or
better. So our opinion was no, we are not on the verge of recession.
Shocks – In mid-October, fear of the Ebola virus had reached a
high level. Global hot spots in the Middle East, Eastern Europe, Asia
and elsewhere seemed to feed investor anxiety. Would these events
drive a bear market? By definition, shocks are tough to predict. We
are not infectious disease experts, but after studying the work of
those who are, we thought a widespread Ebola outbreak outside of
the tragically effected countries in Africa was unlikely. So though
we can never be sure when a shock might surprise us, we did not
think the possible shocks on the horizon would be powerful enough
to cause a bear market.
Valuation – The trailing and forward P/E ratios of the S&P 500
were roughly equal to their historical averages. The dividend yield of
the S&P 500 rose meaningfully above the 10-year Treasury bond
yield in mid-October. The dividend yield on the German DAX index
was about 3%, more than triple the yield on the German Bund.
As recently as 2005, the dividend yield on the DAX was half the
bund yield. Low interest rates might signal a relatively low return
environment over the next several years, but the risk premium
imbedded in stock prices was high enough, we thought, to drive
significant outperformance of stocks versus bonds in the years
ahead. So no, we did not think that valuations were high enough to
cause a bear market.
Public Policy Surprises – Fiscal policy in the U.S. is basically
frozen as a result of differences between the two major parties. We
did not think that would change soon, regardless of the outcome
of the mid-term elections. Might monetary policy suddenly tighten,
and cause a bear market? We thought that unlikely. Chair Yellen
has made it clear that she wants to see significant progress on a
stronger labor market and evidence that inflation was moving up
to or over the Fed’s 2% target before monetary policy would be
meaningfully tightened. With wage growth still modest and inflation
measures more likely to fall than rise due to the sharp drop in oil
prices, we thought that Fed tightening would be unlikely to occur
until mid-2015 or later. We thought an imminent policy shift was
unlikely to cause a bear market.
Having applied our framework, we stuck with our portfolio tilt
towards stocks and other risky assets. We were net buyers of
stocks in mid October, and our clients benefitted from the midmonth rebound.
Of course, no framework is perfect, and we employ more complex
models as well as part of our investment decision-making at QMA.
But in its first real test, we think our simple RSVP framework served
us well.
About QMA
Since 1975, QMA has served investors by combining experienced
judgment with detailed investment research in an attempt to
capture repeatable long-term outperformance. Today, we manage
approximately $112 billion in assets globally for institutions, subadvisory clients and individual investors through a broad mix of
asset allocation, core equity, value equity and indexing solutions.
3INSIGHTS
OR FLIGHT
INSIGHTS THEFIGHT
DRAWDOWN
DILEMMA
These materials represent the views, opinions and recommendations of the author(s) regarding the economic conditions, asset classes, securities, issuers
or financial instruments referenced herein. Distribution of this information to any person other than the person to whom it was originally delivered and to
such person’s advisers is unauthorized, and any reproduction of these materials, in whole or in part, or the divulgence of any of the contents hereof, without
prior consent of Quantitative Management Associates LLC (“QMA”) is prohibited. Certain information contained herein has been obtained from sources
that QMA believes to be reliable as of the date presented; however, QMA cannot guarantee the accuracy of such information, assure its completeness, or
warrant such information will not be changed. The information contained herein is current as of the date of issuance (or such earlier date as referenced
herein) and is subject to change without notice. QMA has no obligation to update any or all of such information; nor do we make any express or implied
warranties or representations as to the completeness or accuracy or accept responsibility for errors. These materials are not intended as an offer or
solicitation with respect to the purchase or sale of any security or other financial instrument or any investment management services and should not be
used as the basis for any investment decision. Past performance may not be indicative of future results. No liability whatsoever is accepted for any loss
(whether direct, indirect, or consequential) that may arise from any use of the information contained in or derived from this report. QMA and its affiliates
may make investment decisions that are inconsistent with the recommendations or views expressed herein, including for proprietary accounts of QMA or
its affiliates.
The opinions and recommendations herein do not take into account individual client circumstances, objectives, or needs and are not intended as
recommendations of particular securities, financial instruments or strategies to particular clients or prospects. No determination has been made regarding the
suitability of any securities, financial instruments or strategies for particular clients or prospects. For any securities or financial instruments mentioned herein,
the recipient(s) of this report must make its own independent decisions.
The financial indices referenced herein are provided for informational purposes only. You cannot invest directly in an index. The statistical data regarding
such indices has been obtained from sources believed to be reliable but has not been independently verified. Large Stocks—Standard & Poor’s 90 index
from 1926 through February 1957 and the S&P 500 index thereafter, which is an unmanaged group of securities and considered to be representative
of the stock market in general. The S&P 500 Index covers 500 industrial, utility, transportation, and financial companies of the U.S. markets. The valueweighted index represents about 75% of the NYSE market capitalization and 30% of the NYSE issues. The DAX (German stock index) is a blue chip
stock market index consisting of the 30 major German companies trading on the Frankfurt Stock Exchange. Investors cannot invest directly in an index.
Certain information contained herein may constitute “forward-looking statements,” (including observations about markets and industry and regulatory
trends as of the original date of this document). Due to various risks and uncertainties, actual events or results may differ materially from those reflected
or contemplated in such forward-looking statements. As a result, you should not rely on such forward looking statements in making any decisions. No
representation or warranty is made as to the future performance or such forward-looking statements.
Copyright 2014 QMA. All rights reserved
QMA-20141112-144


