Chapter8TypeIandType..
advertisement

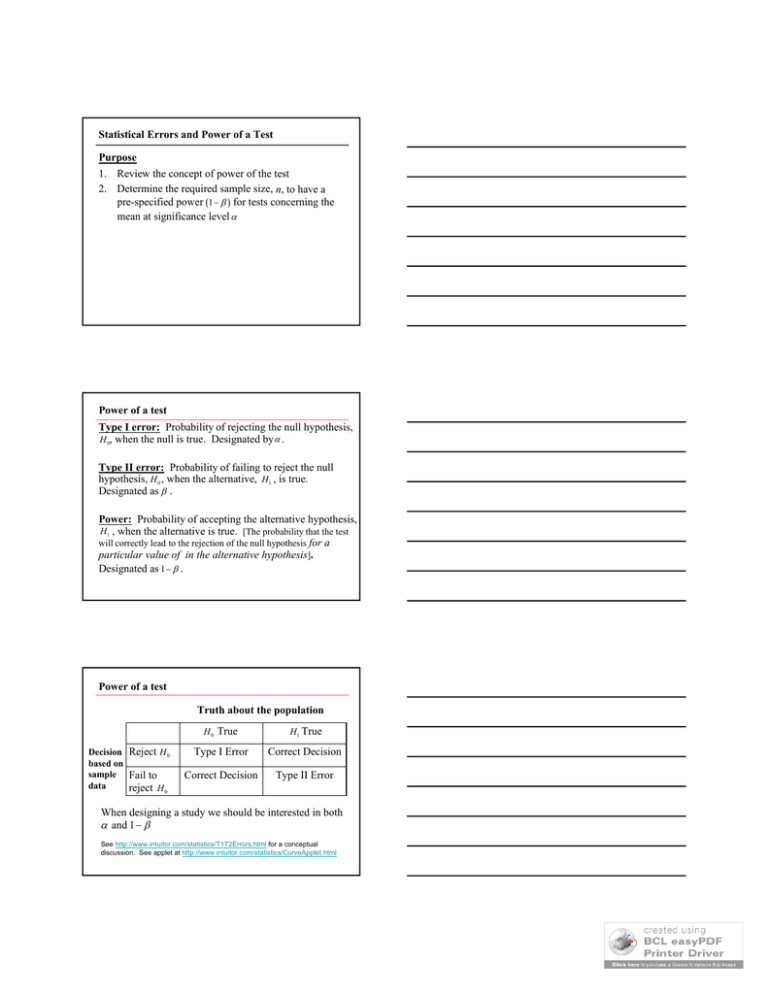
Statistical Errors and Power of a Test Purpose 1. Review the concept of power of the test 2. Determine the required sample size, n, to have a pre-specified power 1 for tests concerning the mean at significance level Power of a test Type I error: Probability of rejecting the null hypothesis, H 0, when the null is true. Designated by . Type II error: Probability of failing to reject the null hypothesis, H 0 , when the alternative, H1 , is true. Designated as . Power: Probability of accepting the alternative hypothesis, H1 , when the alternative is true. [The probability that the test will correctly lead to the rejection of the null hypothesis for a particular value of in the alternative hypothesis]. Designated as 1 . Power of a test Truth about the population Decision Reject H 0 based on sample Fail to data reject H 0 H 0 True H1 True Type I Error Correct Decision Correct Decision Type II Error When designing a study we should be interested in both and 1 See http://www.intuitor.com/statistics/T1T2Errors.html for a conceptual discussion. See applet at http://www.intuitor.com/statistics/CurveApplet.html 1 H 0 : 0 versus H a : 0 Define The distance between means is large enough that P(Type II error) = 0 0 Some overlap, but distance, is still large Distance between null and alternative smaller to a point where power decreases to 0 .99 and P(Type II error) is .01 Beta 2 Distance between null and alternative even smaller; power decreases to 0 .798 and P(Type II error) is .202 What does power depend on? Three factors that will increase the power of a test: • Increase • Increase n, the sample size • Increase the distance between 0 and a Increased alpha from 5% to 10%. Beta decreased from 20.2% to 11.7% 3 Relative Frequency 0.00 0.02 0.04 0.06 0.08 0.10 0.12 Black: Normal with 0 100 and a 115, s X 12, n 5 Red: Normal with 0 100 and a 115, s X 12, n 15 Beta > 0 Alpha = 0.05 80 90 100 110 120 130 Value of Random Variable Relative Frequency 0.00 0.02 0.04 0.06 0.08 0.10 0.12 Black: Normal with 0 100 and a 115, s X 12, n 5 Red: Normal with 0 100 and a 115, s X 12, n 15 Alpha = 0.05 Beta = 0.0 Power = 1.00 80 90 100 110 120 130 Value of Random Variable Summary • As alpha increases, power increases • As n increases, power increases • As the distance between the null and hypothesized values of the mean increases, power increases 4 Summary • For a fixed n and alpha, the value of beta decreases and the power increases as the distance between the specified null value and the specified alternative value increases. • For fixed n and values of the null and hypothesized mean, the value of beta increases and the power decreases as the value of alpha is decreased. • For fixed alpha and values of the null and hypothesized mean, the value of beta decreases and the power increases as the sample size n is increased. See applet at: http://wise.cgu.edu/power/appletover.html 5


