Test rationale and sampling procedure P rotocol C ornstalk T esting
advertisement
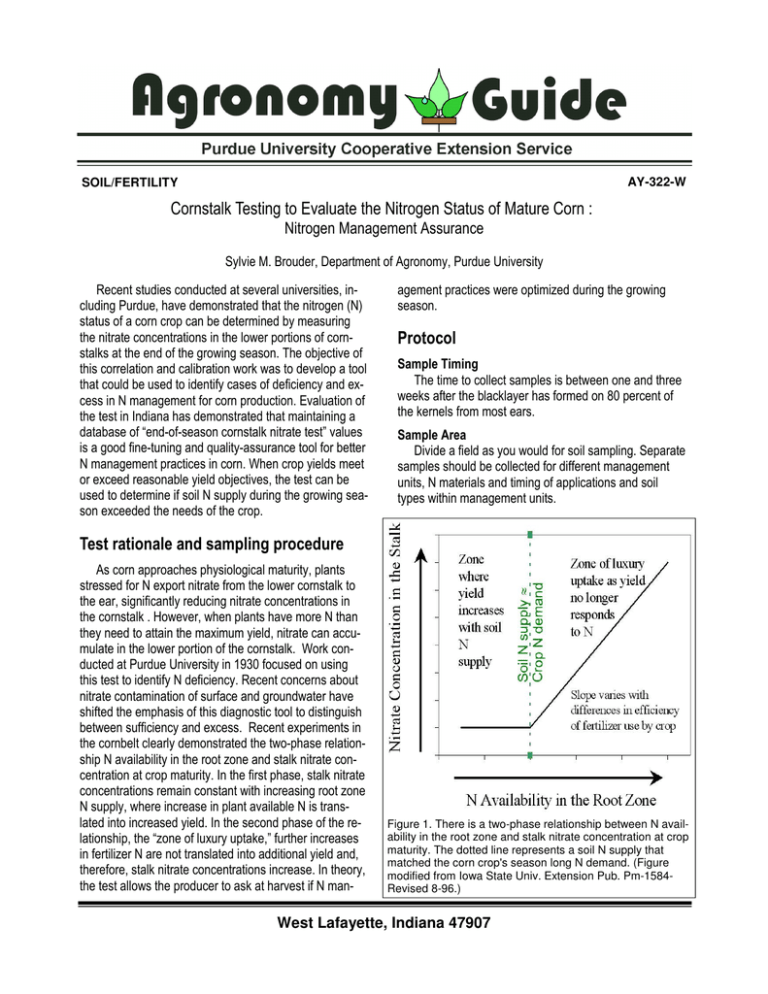
AY-322-W SOIL/FERTILITY 4 # 3 5 3 5 7 5 4 6 ) 2 ) + 0 ! " 1/ # $ % & ' 2 ( " 3 ! " ) " * " ( + , -. / " " 0 $ 0 $ %0 " Figure 1. There is a two-phase relationship between N availability in the root zone and stalk nitrate concentration at crop maturity. The dotted line represents a soil N supply that matched the corn crop's season long N demand. (Figure modified from Iowa State Univ. Extension Pub. Pm-1584Revised 8-96.) & 0 $ West Lafayette, Indiana 47907 1 AY-322-W Figure 3. Diagnosis of in-season N to corn. 3 4 1 8 ,9 3 4 ,: 1 3 0 0 5 4 " " " $ 0 , --8 0 ,. " , --; # . 1 0 9 ,// / ,// <// " " 3 3 0 0 < ) " 0 9:/ = 9:/ ) " $ " 0 0 7 % & ./// 0 = Figure 2. Eight-inch stalk samples should be collected when blacklayers have formed. The formation of the blacklayer (left kernel) signals the end of kernel growth. Kernels near the tip of the ear will mature first. Collect stalks when 80% or more of the kernels have blacklayered. 0 </// . 3 / , / 0 2 AY-322-W ! 7 , -1 8 , --/ $ 3 9: ? ) ;// $ 3 <:/ ;// <:/ % % & & ( <:/ <:/ = 9:/ $ ;// " 6 6 9:/ # ' 3 0 @ 4 * <:/ @ 9:/ 0 " $ 0 0 $ " 6 9:/ </// " 0 , > . 3 ) 0 = " . ! " 6 # </// ) " " " ' $ %& ' 0 " 0 " 3 = AY-322-W $ , < 3 <: 9/ 1/ @ 3 # 9:/ $ " 3 0 < /// " 0 $ $ $ . 9 0 " = <1A " 3 ' " 9 9/ @ 9 @ " 1/ $ 3 0 ! 3 0 Farm History PSNT Result* (ppm) Stalk Nitrate Conc. (ppm) Yield response to N fert. Stalk Nitrate Conc. w/ N fertilizer 40 lbs. 80 lbs. N/acre N/acre Case 1 Continuous Corn, No-Till, Poultry Manure 50.0 2690 No 3194 4246 Case 2 Continuous Corn, Conventional Till, Poultry Manure 43.6 1169 No 4057 4285 Case 3 Corn after soybean, No-Till, preplant application of 28% followed by excessive rain 56.2 4078 No 6777 6144 Case 4 Corn after soybean, No-Till, preplant application of 28% followed by excessive rain 47.2 360 Yes, to 40 lbs. 1195 2911 *PSNT values in excess of 25 ppm are considered to be sufficient to meet the expected N needs of the crop. 4 AY-322-W How Helpful Is the Stalk Nitrate Test? It Depends on the Question… Question: Can it identify corn that produced less than maximum yields because of N stress? 89% of plots that had low yields also had stalk nitrate values below 700 ppm. Answer: Yes Question: Does a low stalk nitrate value always mean a low yield? Answer: No In some cases, maximum yields were observed even though stalk nitrate concentrations were less than 250 ppm. The use efficiency of N by the plants was optimized in these cases. Message: Low stalk N values are likely to be related to N stress only if yields are lower than expected… Question: Can it identify fields or areas within a field that have soil N in excess of crop demand? Answer: Yes 94% of the plots that had received more N than was required to achieve maximum yields had stalk nitrate concentrations in excess of 2,000 ppm. In our studies, manured fields that did not respond to N fertilizer had stalk nitrate concentrations in excess of 1000 ppm and sometimes as high as 4500 ppm. Message: This test is good for identifying when you don’t need to supplement manure with inorganic fertilizer applications... = B 4 7 6@@ .< 3 # <:8; + C = ) > .,9 ( $ 6@@ ) 3 = 0 ( ) ) ) , --8 @) 4 @ <//. B#" ( @) > @) > - 7 ) 5 ) 5 , --8 ,:19 + #" ) 7 $ 3 + $ 3 % 3 5 4 & @ " @ @) > . , 9 ( + C <//. = + 6@@ ) #" @ " @ ( " NEW 9/03 It is the policy of the Purdue University Cooperative Extension Service, David C. Petritz, Director, that all persons shall have equal opportunity and access to the programs and facilities without regard to race, color, sex, religion, national origin, age, marital status, parental status, sexual orientation, or disability. Purdue University is an Affirmative Action University. This material may be available in alternative formats. 1-888-EXT-INFO http://www.ces.purdue.edu/extmedia 5
