Physiologic Characterization of Glioblastoma Multiforme
advertisement
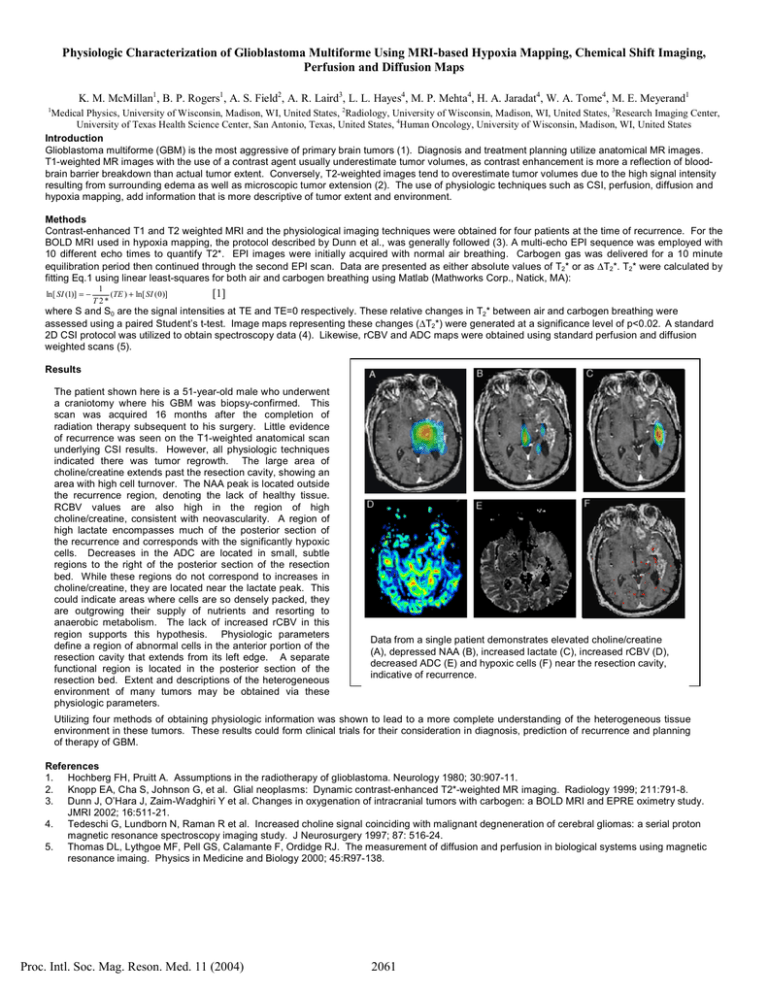
Physiologic Characterization of Glioblastoma Multiforme Using MRI-based Hypoxia Mapping, Chemical Shift Imaging, Perfusion and Diffusion Maps K. M. McMillan1, B. P. Rogers1, A. S. Field2, A. R. Laird3, L. L. Hayes4, M. P. Mehta4, H. A. Jaradat4, W. A. Tome4, M. E. Meyerand1 1 Medical Physics, University of Wisconsin, Madison, WI, United States, 2Radiology, University of Wisconsin, Madison, WI, United States, 3Research Imaging Center, University of Texas Health Science Center, San Antonio, Texas, United States, 4Human Oncology, University of Wisconsin, Madison, WI, United States Introduction Glioblastoma multiforme (GBM) is the most aggressive of primary brain tumors (1). Diagnosis and treatment planning utilize anatomical MR images. T1-weighted MR images with the use of a contrast agent usually underestimate tumor volumes, as contrast enhancement is more a reflection of bloodbrain barrier breakdown than actual tumor extent. Conversely, T2-weighted images tend to overestimate tumor volumes due to the high signal intensity resulting from surrounding edema as well as microscopic tumor extension (2). The use of physiologic techniques such as CSI, perfusion, diffusion and hypoxia mapping, add information that is more descriptive of tumor extent and environment. Methods Contrast-enhanced T1 and T2 weighted MRI and the physiological imaging techniques were obtained for four patients at the time of recurrence. For the BOLD MRI used in hypoxia mapping, the protocol described by Dunn et al., was generally followed (3). A multi-echo EPI sequence was employed with 10 different echo times to quantify T2*. EPI images were initially acquired with normal air breathing. Carbogen gas was delivered for a 10 minute equilibration period then continued through the second EPI scan. Data are presented as either absolute values of T2* or as ∆T2*. T2* were calculated by fitting Eq.1 using linear least-squares for both air and carbogen breathing using Matlab (Mathworks Corp., Natick, MA): ln[ SI (1)] = − 1 (TE ) + ln[ SI ( 0 )] T 2* [1] where S and S0 are the signal intensities at TE and TE=0 respectively. These relative changes in T2* between air and carbogen breathing were assessed using a paired Student’s t-test. Image maps representing these changes (∆T2*) were generated at a significance level of p<0.02. A standard 2D CSI protocol was utilized to obtain spectroscopy data (4). Likewise, rCBV and ADC maps were obtained using standard perfusion and diffusion weighted scans (5). Results The patient shown here is a 51-year-old male who underwent a craniotomy where his GBM was biopsy-confirmed. This scan was acquired 16 months after the completion of radiation therapy subsequent to his surgery. Little evidence of recurrence was seen on the T1-weighted anatomical scan underlying CSI results. However, all physiologic techniques indicated there was tumor regrowth. The large area of choline/creatine extends past the resection cavity, showing an area with high cell turnover. The NAA peak is located outside the recurrence region, denoting the lack of healthy tissue. RCBV values are also high in the region of high choline/creatine, consistent with neovascularity. A region of high lactate encompasses much of the posterior section of the recurrence and corresponds with the significantly hypoxic cells. Decreases in the ADC are located in small, subtle regions to the right of the posterior section of the resection bed. While these regions do not correspond to increases in choline/creatine, they are located near the lactate peak. This could indicate areas where cells are so densely packed, they are outgrowing their supply of nutrients and resorting to anaerobic metabolism. The lack of increased rCBV in this region supports this hypothesis. Physiologic parameters define a region of abnormal cells in the anterior portion of the resection cavity that extends from its left edge. A separate functional region is located in the posterior section of the resection bed. Extent and descriptions of the heterogeneous environment of many tumors may be obtained via these physiologic parameters. Data from a single patient demonstrates elevated choline/creatine (A), depressed NAA (B), increased lactate (C), increased rCBV (D), decreased ADC (E) and hypoxic cells (F) near the resection cavity, indicative of recurrence. Utilizing four methods of obtaining physiologic information was shown to lead to a more complete understanding of the heterogeneous tissue environment in these tumors. These results could form clinical trials for their consideration in diagnosis, prediction of recurrence and planning of therapy of GBM. References 1. Hochberg FH, Pruitt A. Assumptions in the radiotherapy of glioblastoma. Neurology 1980; 30:907-11. 2. Knopp EA, Cha S, Johnson G, et al. Glial neoplasms: Dynamic contrast-enhanced T2*-weighted MR imaging. Radiology 1999; 211:791-8. 3. Dunn J, O’Hara J, Zaim-Wadghiri Y et al. Changes in oxygenation of intracranial tumors with carbogen: a BOLD MRI and EPRE oximetry study. JMRI 2002; 16:511-21. 4. Tedeschi G, Lundborn N, Raman R et al. Increased choline signal coinciding with malignant degneneration of cerebral gliomas: a serial proton magnetic resonance spectroscopy imaging study. J Neurosurgery 1997; 87: 516-24. 5. Thomas DL, Lythgoe MF, Pell GS, Calamante F, Ordidge RJ. The measurement of diffusion and perfusion in biological systems using magnetic resonance imaing. Physics in Medicine and Biology 2000; 45:R97-138. Proc. Intl. Soc. Mag. Reson. Med. 11 (2004) 2061
