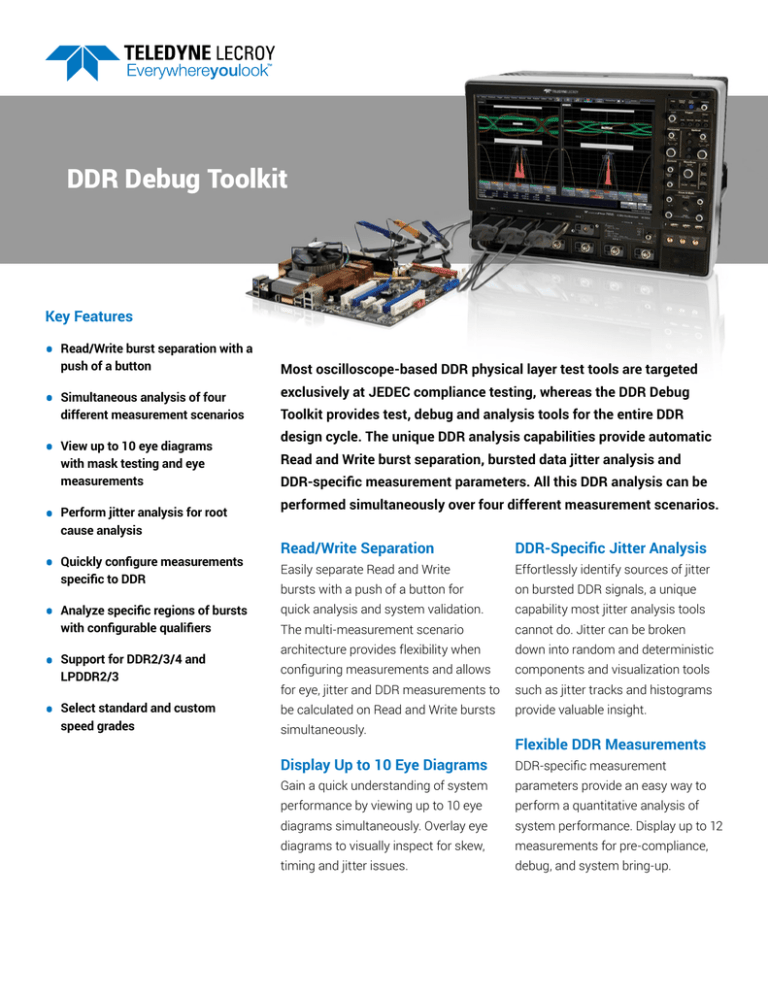
DDR Debug Toolkit
Key Features
•
ead/Write burst separation with a
R
push of a button
•
imultaneous analysis of four
S
different measurement scenarios
•
iew up to 10 eye diagrams
V
with mask testing and eye
measurements
•
erform jitter analysis for root
P
cause analysis
•
uickly configure measurements
Q
specific to DDR
•
nalyze specific regions of bursts
A
with configurable qualifiers
•
upport for DDR2/3/4 and
S
LPDDR2/3
•
elect standard and custom
S
speed grades
Most oscilloscope-based DDR physical layer test tools are targeted
exclusively at JEDEC compliance testing, whereas the DDR Debug
Toolkit provides test, debug and analysis tools for the entire DDR
design cycle. The unique DDR analysis capabilities provide automatic
Read and Write burst separation, bursted data jitter analysis and
DDR-specific measurement parameters. All this DDR analysis can be
performed simultaneously over four different measurement scenarios.
Read/Write Separation
DDR-Specific Jitter Analysis
Easily separate Read and Write
Effortlessly identify sources of jitter
bursts with a push of a button for
on bursted DDR signals, a unique
quick analysis and system validation.
capability most jitter analysis tools
The multi-measurement scenario
cannot do. Jitter can be broken
architecture provides flexibility when
down into random and deterministic
configuring measurements and allows
components and visualization tools
for eye, jitter and DDR measurements to
such as jitter tracks and histograms
be calculated on Read and Write bursts
provide valuable insight.
simultaneously.
Flexible DDR Measurements
Display Up to 10 Eye Diagrams
DDR-specific measurement
Gain a quick understanding of system
parameters provide an easy way to
performance by viewing up to 10 eye
perform a quantitative analysis of
diagrams simultaneously. Overlay eye
system performance. Display up to 12
diagrams to visually inspect for skew,
measurements for pre-compliance,
timing and jitter issues.
debug, and system bring-up.
COMPREHENSIVE DDR PHYSICAL LAYER ANALYSIS
The DDR Debug Toolkit provides test, debug and
analysis tools for the entire DDR design cycle,
making it the ultimate DDR analysis solution.
1. Eye Diagrams Analysis
Depending upon the measurement scenario eye
diagrams are filtered to display all acquired Read
or Write unit intervals (UI). Each scenario and the
reference scenario can display two eye diagrams,
allowing for a maximum of ten eye diagrams to be
analyzed simultaneously. Eye diagrams from the same
measurement scenarios can be overlaid to show critical
timing information.
2. Eye Mask Testing
Select a standard defined mask or choose a custom
mask for specialized testing. Mask failures are
1
highlighted to show the exact points where failures occur.
2
3. Jitter Track Analysis
Display Time Interval Error (TIE) jitter track to view how
jitter in the system is changing as a function of time. This
analysis will clearly show if there are any time correlated
jitter effects such as jitter modulation.
4. Jitter Histogram Analysis
A histogram of the TIE data provides a quick way to clearly
determine if jitter aggressors are causing non-Gaussian
distributions or long tails.
5. Bathtub Curve
The bathtub curve is a standard plot used to understand
the degree to which an eye diagram is closed due to jitter
6
7
8
at a given bit error ratio (BER).
6. Eye Measurement Table
7. Jitter Measurements Table
Display up to 8 standard eye measurements
Total jitter (Tj) can be separated into deterministic jitter
simultaneously. Use parameters such as eye height and
(Dj) and random jitter (Rj) and can be further classified as
eye width to perform a quantitative assessment of how
Duty Cycle Distortion (DCD). Peak-Peak and RMS jitter are
performance varies across all enabled scenarios.
available as alternative jitter calculation methods. All jitter
can be calculated in time or UI. Results are tabulated for
all enabled measurement scenarios.
2
9
3
5
4
8. DDR Measurements Table
9. Completely Integrated Toolset
Enable up to 12 DDR specific measurements at a time to
DDR Debug Toolkit waveform displays and calculations
provide a quick overview of system performance for all
are a completely integrated part of the oscilloscope
active scenarios. Configure each measurement to show
analysis toolset. Any DDR Debug Toolkit function
advanced statistics (min, max, mean, count) and select
can be displayed with any other channel acquisition,
the measurement source.
math function, or measurement parameter on the
oscilloscope grid.
3
POWERFUL DDR DEBUG CAPABILITIES
The bursted nature of DDR signals makes it very different than most serial data communication standards.
As a result, the traditional oscilloscope-based methods and algorithms for measuring jitter and analyzing
system performance are not capable of measuring DDR signals. The DDR Debug Toolkit uses jitter algorithms
which have been tailored for bursted DDR signals. Built-in DDR measurement parameters provide various
JEDEC compliance measurements which are important for debugging and characterizing DDR systems.
Read/Write Burst Separation
with a Push of a Button
DDR Jitter Analysis
DDR-Specific Parameters
Bursted DDR signals create undesirable
With a toolbox of parameters specific
Automatically separate Read and Write
complications and challenges for
to DDR it is simple to quickly configure
bursts with the DDR Debug Toolkit,
traditional serial data analysis and
insightful measurements for validation,
eliminating the time consuming process
jitter tools preventing analysis of
characterization, and debug. Up to 12
of manual burst identification and
DQ, DQS and address signals. Jitter
configurable measurements can be
simplifying the analysis of DDR system
parameters including Tj, Rj, and Dj
displayed and analyzed simultaneously
performance and validation.
are calculated across all active DDR
across all active measurement
measurement scenarios. To gain a
scenarios. For each measurement,
deeper understanding of the jitter
advanced statistics such as min, max,
distribution, traditional displays such as
mean, and number of measurement
TIE histograms, TIE track, and bathtub
instances can be displayed.
curves are available.
4
EXTENSIVE EYE DIAGRAM TESTING
An eye diagram is one of the easiest ways to gain a quick understanding of DDR system performance.
The DDR Debug Toolkit leverages Teledyne LeCroy’s industry leading serial data analysis algorithms and eye
diagram rendering tools to provide a unique way to view DDR system performance.
View Up to 10 Eye Diagrams
Simultaneously
The DDR Debug Toolkit can quickly
create and display up to 10 eye
diagrams simultaneously with a push
of a button. Visual inspection and
analysis of side-by-side eye diagrams
can provide valuable skew and timing
information. Choosing to have CK or
DQS as the timing reference provides
two different vantage points of system
performance.
A complete system view is obtained by assigning measurement scenarios to DQ-Read,
DQ-Write, DQS-Read and DQS-Write. The reference scenario shows the DQ-Write eye while the
system was using a different termination scheme.
Eye Diagram Analysis
Using the DDR Debug Toolkit any DQ,
DQS or address signal can be tested
against a standard or a custom
defined mask. Enabling mask
failure indicators will automatically
identify any mask violations. Built-in
measurements such as eye height, eye
width and eye opening are critical to
gaining a quantitative understanding
of the system performance. With
simultaneous eye measurements it is
easy to compare performance across
multiple testing scenarios.
DDR3 Read and Write DQ eyes are displayed side by side. The DDR3 mask is created using the
AC/DC levels and the tDS/tDH limits from the JEDEC specification.
5
FLEXIBLE MEASUREMENT CONFIGURATION
Multiple measurement scenarios
allow the DDR Debug Toolkit to be
tailored to meet specific analysis
needs. Leveraging LaneScape™
Comparison Mode enables a
customized layout of the analysis
tools, with options to display one,
two or all scenarios simultaneously
for easy comparisons.
Four Measurement Scenarios
Reference Scenario for Optimization Testing
When configuring a measurement, each scenario can
The Reference Scenario allows engineers to easily conduct
be independently assigned a signal providing extensive
performance tuning or optimization tests. The user is able to
flexibility for analysis. For example, it is simple to setup a
store any measurement scenario into a reference scenario,
comparison of system performance between read and write
then make a change to their setup to observe a change in any
burst operation across multiple DQ lanes. Simultaneous
performance characteristics. Measurements can be added or
analysis of up to four measurement scenarios simplifies the
removed from the reference scenario at any time so there is
measurement process and eliminates concerns about making
no need to worry about having all analysis parameters
unsynchronized measurements.
defined at the beginning of testing.
Analyze Isolated Regions of Bursts
Using built-in configurable qualifiers, all of the analysis in the
DDR Debug Toolkit can be gated to include or ignore the first
“n” bits. This allows for a deep understanding of how the system is performing under specific conditions. For example, this
type of analysis can be used to gain knowledge about how the
system is functioning coming out of preamble or exclusively
in the middle of burst operation.
6
SPECIFICATIONS
Common Settings
Protocols
DDR2, DDR3, DDR3L, DDR4, LPDDR2, LPDDR3
Speed Grades
200, 266, 333, 400, 466, 533, 667, 800, 933, 1066, 1333, 1600, 1866, 2133, 2400, 2666, 3200, Custom
AC Threshold
AC300, AC250, AC220, AC200, AC175, AC160, AC150, AC135, AC125, AC120
Vref
Standard (VDD/2) or Custom
Measurement Scenario Settings
Number of Measurement Scenarios
4 and 1 reference
Analysis Type
DQ-Read, DQ-Write, DQS-Read, DQS-Write, ADDR
Second Eye
DQ, DQS, CK
Timing Reference
CK or DQS
Input Signals Sources
Analog Channel, EyeDrII, VirtualProbe, Math, Memory, Zoom
Analysis Tools
Eye Parameters
Eye Height, Eye Width, Eye Amplitude, Eye Crossing, Mask Hits, Mask Out, One Level, Zero Level
Eye Mask
Standard or Custom
Jitter Plots
TIE Track, TIE Histogram, Cumulative Distribution Function (CDF), Q-FIT Tail Representation, Bathtub
Jitter Parameters
Tj, Rj, Dj, DCD, Pk-Pk, RMS
DDR Measurements
Bursts, Transitions, VH(ac), VH(dc), VL(ac), VL(dc), tDH, tDS, tIH, tIS, tDQSCK, tDQSQ, SlewRise, SlewFall, Vref
DDR Measurement Type
Mean, Max, Min, Number
DDR Measurement Sources
DQ, DQS, CK, ADDR, DQ&DQS, DQS&CK
Analysis Qualifiers
Include only first "N" bits or ignore first "N" bits
Lanescape Comparison Mode
Single: One lane is displayed at a time
Dual: Two lanes are selected for display
Mosaic: All enabled lanes are displayed
7
ORDERING INFORMATION
Product Description
Product Code
DDR2
DDR2 and LPDDR2 Debug Toolkit for
WaveRunner 6 Zi Oscilloscopes
WR6ZI-DDR2-TOOLKIT
DDR2 and LPDDR2 Debug Toolkit for
WavePro 7 Zi Oscilloscopes
WPZI-DDR2-TOOLKIT
DDR2 and LPDDR2 Debug Toolkit for
WaveMaster 8 Zi Oscilloscopes
WM8ZI-DDR2-TOOLKIT
DDR2 and LPDDR2 Debug Toolkit for
LabMaster 9 Zi-A Oscilloscopes
LM9ZI-DDR2-TOOLKIT
DDR2 and LPDDR2 Debug Toolkit for
WaveRunner 10 Zi Oscilloscopes
LM10ZI-DDR2-TOOLKIT
DDR3, DDR3L, LPDDR3, DDR2, and LPDDR2
WR6ZI-DDR3-TOOLKIT
Debug Toolkit for WaveRunner 6 Zi Oscilloscopes
DDR3
DDR3, DDR3L, LPDDR3, DDR2, and LPDDR2
Debug Toolkit for WavePro 7 Zi Oscilloscopes
WPZI-DDR3-TOOLKIT
DDR3, DDR3L, LPDDR3, DDR2, and LPDDR2
WM8ZI-DDR3-TOOLKIT
Debug Toolkit for WaveMaster 8 Zi Oscilloscopes
DDR3, DDR3L, LPDDR3, DDR2, and LPDDR2
LM9ZI-DDR3-TOOLKIT
Debug Toolkit for LabMaster 9 Zi-A Oscilloscopes
DDR4
DDR3, DDR3L, LPDDR3, DDR2, and LPDDR2
LM10ZI-DDR3-TOOLKIT
Debug Toolkit for LabMaster 10 Zi Oscilloscopes
DDR4, DDR3, DDR3L, LPDDR3, DDR2, and
LPDDR2 Debug Toolkit for WaveMaster 8 Zi
Oscilloscopes
DDR4, DDR3, DDR3L, LPDDR3, DDR2, and
LPDDR2 Debug Toolkit for LabMaster 9 Zi-A
Oscilloscopes
DDR4, DDR3, DDR3L, LPDDR3, DDR2, and LPDDR2 Debug Toolkit for LabMaster 10 Zi
Oscilloscopes
WM8ZI-DDR4-TOOLKIT
LM9ZI-DDR4-TOOLKIT
LM10ZI-DDR4-TOOLKIT
DDR Debug Toolkit Upgrades
DDR3
Product Code
Recommended Probes
DDR Debug Toolkits
DDR4
Product Description
DDR3, DDR3L, LPDDR3, DDR2, and
LPDDR2 Debug Toolkit Upgrade for
WaveRunner 6 Zi Oscilloscopes
DDR3, DDR3L, LPDDR3, DDR2, and
LPDDR2 Debug Toolkit Upgrade for
WavePro 7 Zi Oscilloscopes
DDR3, DDR3L, LPDDR3, DDR2, and
LPDDR2 Debug Toolkit Upgrade for
WaveMaster 8 Zi Oscilloscopes
DDR3, DDR3L, LPDDR3, DDR2, and
LPDDR2 Debug Toolkit Upgrade for
LabMaster 9 Zi-A Oscilloscopes
DDR3, DDR3L, LPDDR3, DDR2, and
LPDDR2 Debug Toolkit Upgrade for
LabMaster 10 Zi Oscilloscopes
WR6ZI-UPG-DDR3-TOOLKIT
WPZI-UPG-DDR3-TOOLKIT
WM8ZI-UPG-DDR3-TOOLKIT
LM9ZI-UPG-DDR3-TOOLKIT
LM10ZI-UPG-DDR3-TOOLKIT
DDR4, DDR3, DDR3L, LPDDR3, DDR2,
and LPDDR2 Debug Toolkit Upgrade for
WaveMaster 8 Zi Oscilloscopes
DDR4, DDR3, DDR3L, LPDDR3, DDR2,
and LPDDR2 Debug Toolkit Upgrade for
LabMaster 9 Zi-A Oscilloscopes
DDR4, DDR3, DDR3L, LPDDR3, DDR2,
and LPDDR2 Debug Toolkit Upgrade for
LabMaster 10 Zi Oscilloscopes
WM8ZI-UPG-DDR4-TOOLKIT
WaveLink 6 GHz, 2.5 Vp-p Differential Probe System
D410-PS
WaveLink 6 GHz, 5 Vp-p Differential Probe System
D420-PS
WaveLink 6 GHz, 2.5 Vp-p Differential Probe System
D610-PS
WaveLink 6 GHz, 5 Vp-p Differential Probe System
D620-PS
WaveLink 8 GHz, 3.5 Vp-p Differential Probe System
D830-PS
WaveLink 10 GHz, 3.5 Vp-p Differential Probe System
D1030-PS
WaveLink 13 GHz, 3.5 Vp-p Differential Probe System
D1330-PS
DDR
Protocol
Recommended Recommended
Bandwidth
Oscilloscope
DDR2
(All Speeds)
LPDDR2
(All Speeds)
DDR3
(1600 MT/s
or less)
DDR3
(1866 MT/s
or more)
DDR3L
(All Speeds)
LPDDR3
(1600 MT/s
or less)
DDR4
(All Speeds)
4 GHz
Recommended
Probe
WaveRunner
640Zi
WaveRunner
640Zi
WavePro
760Zi-A
D410-PS / D420-PS
(Qty. 3 or 4)
D410-PS / D420-PS
(Qty. 3 or 4)
D610-PS / D620-PS
(Qty. 3 or 4)
8 GHz
WaveMaster
808Zi-A
D830-PS
(Qty. 3 or 4)
8 GHz
WaveMaster
808Zi-A
WavePro
760Zi-A
D830-PS
(Qty. 3 or 4)
D610-PS / D620-PS
(Qty. 3 or 4)
WaveMaster
813Zi-A
D1330-PS
(Qty. 3 or 4)
4 GHz
6 GHz
6 GHz
13 GHz
Need Compliance
Testing?
QualiPHY is designed to reduce the time, effort, and
specialized knowledge needed to perform compliance
testing on high-speed serial buses.
• Support for DDR2/3/4 and LPDDR2/3
• Performs each measurement in accordance with
the JEDEC standard
• Guides the user through each test setup
• Compares each measured value with the applicable
specification limits
LM9ZI-UPG-DDR4-TOOLKIT
LM10ZI-UPG-DDR4-TOOLKIT
1-800-5-LeCroy
teledynelecroy.com
• Fully documents all results
• QualiPHY helps the user perform testing the right way —
every time!
Local sales offices are located throughout the world.
Visit our website to find the most convenient location.
© 2014 Teledyne LeCroy, Inc. All rights reserved. Specifications, prices, availability, and delivery subject to change without notice.
Product or brand names are trademarks or requested trademarks of their respective holders.
ddr-debug-toolkit-ds-04mar15


