Year 9 revision topics (higher) Number • Be able to add, subtract
advertisement
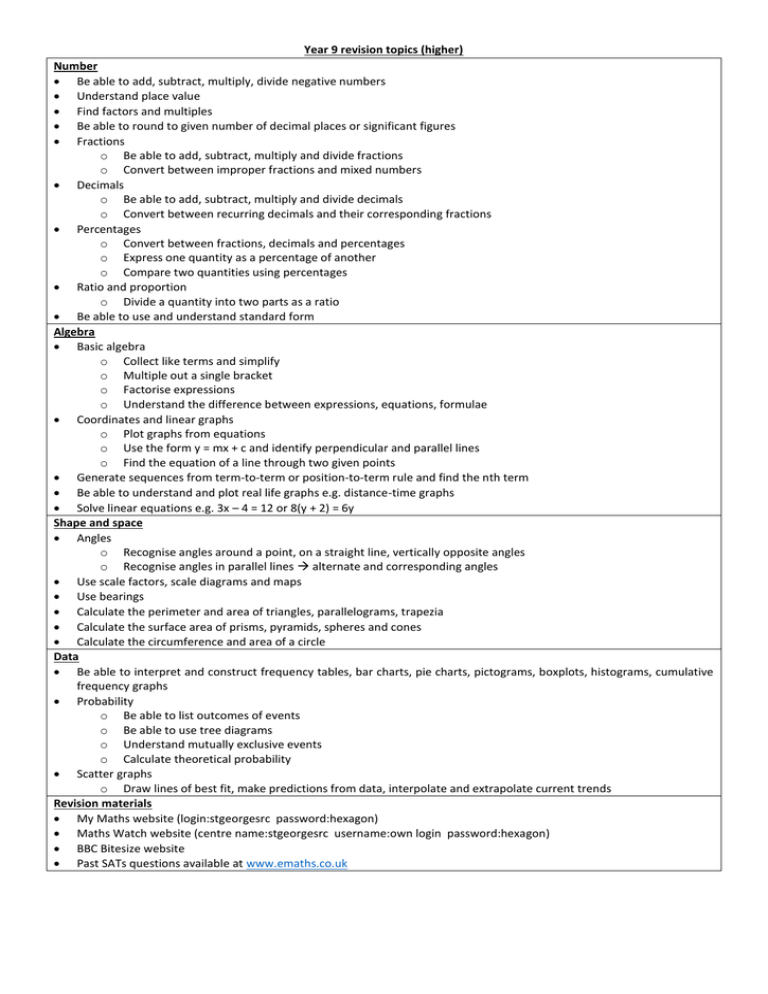
Year 9 revision topics (higher) Number Be able to add, subtract, multiply, divide negative numbers Understand place value Find factors and multiples Be able to round to given number of decimal places or significant figures Fractions o Be able to add, subtract, multiply and divide fractions o Convert between improper fractions and mixed numbers Decimals o Be able to add, subtract, multiply and divide decimals o Convert between recurring decimals and their corresponding fractions Percentages o Convert between fractions, decimals and percentages o Express one quantity as a percentage of another o Compare two quantities using percentages Ratio and proportion o Divide a quantity into two parts as a ratio Be able to use and understand standard form Algebra Basic algebra o Collect like terms and simplify o Multiple out a single bracket o Factorise expressions o Understand the difference between expressions, equations, formulae Coordinates and linear graphs o Plot graphs from equations o Use the form y = mx + c and identify perpendicular and parallel lines o Find the equation of a line through two given points Generate sequences from term-to-term or position-to-term rule and find the nth term Be able to understand and plot real life graphs e.g. distance-time graphs Solve linear equations e.g. 3x – 4 = 12 or 8(y + 2) = 6y Shape and space Angles o Recognise angles around a point, on a straight line, vertically opposite angles o Recognise angles in parallel lines alternate and corresponding angles Use scale factors, scale diagrams and maps Use bearings Calculate the perimeter and area of triangles, parallelograms, trapezia Calculate the surface area of prisms, pyramids, spheres and cones Calculate the circumference and area of a circle Data Be able to interpret and construct frequency tables, bar charts, pie charts, pictograms, boxplots, histograms, cumulative frequency graphs Probability o Be able to list outcomes of events o Be able to use tree diagrams o Understand mutually exclusive events o Calculate theoretical probability Scatter graphs o Draw lines of best fit, make predictions from data, interpolate and extrapolate current trends Revision materials My Maths website (login:stgeorgesrc password:hexagon) Maths Watch website (centre name:stgeorgesrc username:own login password:hexagon) BBC Bitesize website Past SATs questions available at www.emaths.co.uk
