Harp Versus Serpentine Collectors
advertisement

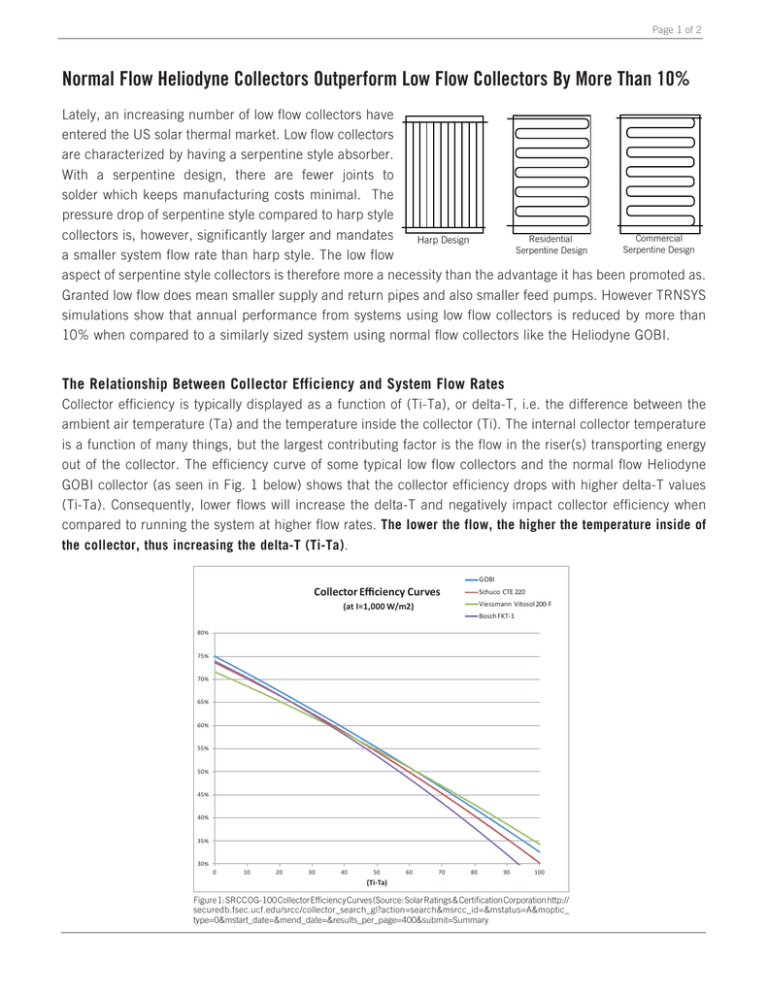
Page 1 of 2 Normal Flow Heliodyne Collectors Outperform Low Flow Collectors By More Than 10% Lately, an increasing number of low flow collectors have entered the US solar thermal market. Low flow collectors are characterized by having a serpentine style absorber. With a serpentine design, there are fewer joints to solder which keeps manufacturing costs minimal. The pressure drop of serpentine style compared to harp style collectors is, however, significantly larger and mandates Commercial Residential Harp Design Serpentine Design Serpentine Design a smaller system flow rate than harp style. The low flow aspect of serpentine style collectors is therefore more a necessity than the advantage it has been promoted as. Granted low flow does mean smaller supply and return pipes and also smaller feed pumps. However TRNSYS simulations show that annual performance from systems using low flow collectors is reduced by more than 10% when compared to a similarly sized system using normal flow collectors like the Heliodyne GOBI. The Relationship Between Collector Efficiency and System Flow Rates Collector efficiency is typically displayed as a function of (Ti-Ta), or delta-T, i.e. the difference between the ambient air temperature (Ta) and the temperature inside the collector (Ti). The internal collector temperature is a function of many things, but the largest contributing factor is the flow in the riser(s) transporting energy out of the collector. The efficiency curve of some typical low flow collectors and the normal flow Heliodyne GOBI collector (as seen in Fig. 1 below) shows that the collector efficiency drops with higher delta-T values (Ti-Ta). Consequently, lower flows will increase the delta-T and negatively impact collector efficiency when compared to running the system at higher flow rates. The lower the flow, the higher the temperature inside of the collector, thus increasing the delta-T (Ti-Ta). GOBI Collector Efficiency Curves Schuco CTE 220 Viessmann Vitosol 200-F (at I=1,000 W/m2) Bosch FKT-1 80% 75% 70% 65% 60% 55% 50% 45% 40% 35% 30% 0 10 20 30 40 50 60 70 80 90 100 (Ti-Ta) Figure1: 1:SRCC SRCC OG-100 collector efficiency curves OG-100 Collector Efficiency Curves (Source: Solar Ratings & Certification Corporation http:// securedb.fsec.ucf.edu/srcc/collector_search_gl?action=search&msrcc_id=&mstatus=A&moptic_ type=0&mstart_date=&mend_date=&results_per_page=400&submit=Summary Page 2 of 2 Using a Low Flow Collector Has Huge Negative Impact On System Performance To compare the low versus normal flow impact on system performance, Heliodyne contracted Solem Consulting, an independent engineering firm to run TRNSYS simulations. Two equally sized systems were used. One simulation was made with one of the low flow collectors using a serpentine style absorber, while the other simulation was made using the normal flow Heliodyne GOBI collector with a harp style absorber. Performance of each system was simulated at different flow rates and the results plotted into a curve with kBTU’s on the y-axis and flow rate on the x-axis as shown in Figure 2. Parasitic energy losses from the pumps are taken into consideration in the performance simulations. Annual Solar Gain (kBTUs) 360,000 Harp style collector: 0.031 GPM/FT2 355,000 350,000 345,000 340,000 335,000 330,000 325,000 320,000 315,000 Serpentine style collector: 0.0057 GPM/FT2 310,000 305,000 0.0000 0.0050 0.0100 0.0150 0.0200 0.0250 0.0300 0.0350 SPECIFIC FLOWRATE (GPM/FT2) Figure 2: Flow rate performance (Source: TRNSYS Modleing of Solar Hot Water Systems (Report AU2011-124-P v. 1) by Solem Consulting) The performance curves of the two systems at varying flow rates were more or less identical and show only a moderate penalty on the performance down to a flow rate of 0.015 gpm/ft2. Below that point the performance penalty becomes significant. Plotting in the manufacturers recommended flow rates shows that GOBI collector outperforms the low flow collectors by more than 10%. Translating that into an investment perspective, investors using low flow collectors should comparably get a significant lower collector price ft2 to ft2 compensating for the lower output. A system of 32 GOBI collectors produces roughly 5,000 Therms if installed in northern California. A similar sized system using low flow collectors would consequently produce around 500 Therms less per year. Taking into account the current price per Therm of $1 and a conservatively estimated 20-year life span of the system, the net present value of the loss of performance from a low flow system would be at least $10,000. If energy prices goes up the dollar amount would be even greater. Can the pipe size be optimized on a Heliodyne system? With copper prices fluctuating, they can get high enough HELIODYNE 32 GOBI 410 COLLECTOR SYSTEM ANNUAL SOLAR GAIN (kBTUs) VS. TOTAL SYSTEM FLOW where pipe size from a cost perspective becomes an important design criterion. By knowing how the system will perform at various flow rates, the designer can optimize pipe size thus pipe cost. This information can be used to hedge costs against the potential lost savings from a lower flow rate. The relationships between system performances flow rates and pipe sizes are shown in Figure 3 for a 32 GOBI collector 2” 1-1/2” system. This example is for a system based in San Francisco 1-1/4” with 200ft round trip pipe run with a 50/50 glycol mix. By 1” using clean steel pipes, the costs can be lowered making piping expenses less significant to design. 500,000 480,000 460,000 440,000 420,000 400,000 380,000 0 5 10 15 20 25 30 35 40 45 TOTAL SYSTEM FLOWRATE (GPM) RECOMMENDED PIPE SELECTIONS TO ALLOW 50% GLYCOL SOLUTION FLUID VELOCITY <5 FT/S BASED ON A 200 FT TOTAL PIPE RUN. Figure 3: Pipe Sizing (Source, Heliodyne) Figure 3: Pipe Sizing (Source: Heliodyne) Author - Nicole Cusick, Chief Engineer/ Product Manager, Heliodyne


