2011-02-19
Developing Applications with the NI Lab…
Hello Jeff C. (This is not me)
Document Type: Tutorial
NI Supported: Yes
Publish Date: Mar 8, 2010
Developing Applications with the NI LabVIEW Statechart
Module
Overview
This document explains the definition of statechart diagrams and demonstrates the basics of the LabVIEW Statechart
Module.
Table of Contents
1.
2.
3.
4.
5.
Introduction
Using LabVIEW Statecharts
Benefits of Statecharts
Conclusion
Related Links
Introduction
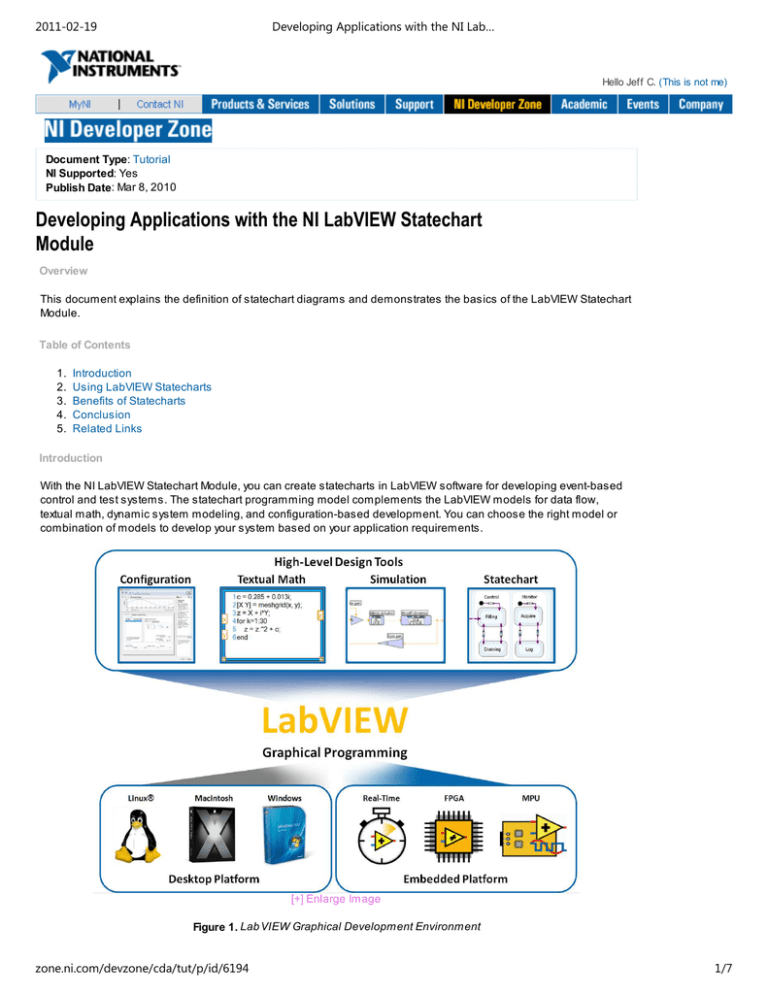
With the NI LabVIEW Statechart Module, you can create statecharts in LabVIEW software for developing event-based
control and test systems. The statechart programming model complements the LabVIEW models for data flow,
textual math, dynamic system modeling, and configuration-based development. You can choose the right model or
combination of models to develop your system based on your application requirements.
[+] Enlarge Image
Figure 1. Lab VIEW Graphical Development Environment
zone.ni.com/devzone/cda/tut/p/id/6194
1/7
2011-02-19
Developing Applications with the NI Lab…
The National Instruments graphical system design platform combines the programming models in LabVIEW with offthe-shelf desktop and embedded controllers and measurement I/O. With this combination, you have an integrated
development toolchain for designing, prototyping, and deploying systems. LabVIEW statecharts offer a high-level
design tool with powerful scalability through programming concepts such as hierarchy, concurrency, and events.
Because statecharts provide a system-level view, you can use LabVIEW statecharts as executable specifications. The
statechart programming model is especially useful for developing complex systems that must respond to a variety of
events such as embedded control systems and communications systems. With the LabVIEW Statechart Module, you
can deploy designs to a variety of hardware platforms ranging from desktop PCs to field-programmable gate arrays
(FPGAs).
Note: For complete LabVIEW Statechart Module documentation, refer to the shipping documentation.
History of Statecharts
The statechart diagram was invented by David Harel of the Weizmann Institute of Science in the 1980s. According to
Harel, the purpose of the statechart diagram was to “extend conventional state-transition diagrams with D the notions
of hierarchy, concurrency, and communication.” Harel invented the diagram while he helped design a complex
avionics system, presumably finding the existing tools for such a system lacking. In the 1990s, statecharts were
adopted as a behavior diagram within the Unified Modeling Language (UML) specification, which is widely used for
modeling embedded systems.
How Statecharts Work
To begin understanding statecharts, it is best to start with the classic state diagram and then add the notions of
hierarchy, concurrency, and events. The classic state diagram consists of two main constructs: states and transitions.
In Figure 2, the state diagram describes a simple soda vending machine with five states and seven transitions to
illustrate how the machine operates. The machine starts in the “idle” state and transitions to the “count coins” state
when coins are inserted. The state diagram shows additional states and transitions when the machine waits for a
selection, dispenses a soda, and gives change.
Figure 2. State Diagram Describ ing a Simple Soda Vending Machine
Figure 3 shows a statechart that describes the behavior of the same machine. Notice how the notion of hierarchy and
events reduces the number of states and transitions. In the statechart, you can nest the “count coins” and “dispense”
states within a superstate. You have to define only one transition (T3) from either of these two states to the “give
change” state. You can configure the T3 transition to respond to three events: soda dispensed, change requested, or
coins rejected. Additionally, you can eliminate the “select soda” state in the classic state diagram by introducing a
“guard” condition to transition T2. Guard conditions must evaluate to “true” for the transition to occur. If the result of the
guard condition is “false,” the event is ignored and the transition does not take place.
zone.ni.com/devzone/cda/tut/p/id/6194
2/7
2011-02-19
Developing Applications with the NI Lab…
[+] Enlarge Image
Figure 3. Statechart Describ ing a Simple Soda Vending Machine
At this point, you can expand the statechart to demonstrate the notion of concurrency by adding a temperature control
element to the software within the vending machine. Figure 4 shows how you can encapsulate the dispensing logic
and the temperature control into an and-state. And-states describe a system that is simultaneously in two states that
are independent of each other. The T7 transition shows how statecharts can define an exit that applies to both substatecharts.
[+] Enlarge Image
Figure 4. Encapsulating the Dispensing Logic and the Temperature Control into an And-State
zone.ni.com/devzone/cda/tut/p/id/6194
3/7
2011-02-19
Developing Applications with the NI Lab…
In addition to hierarchy and concurrency, statecharts have features that make them valuable for complex systems.
Statecharts have a concept of history, allowing a superstate to “remember” which substate within it was previously
active. For example, consider a superstate that describes a machine that pours a substance and then heats it. A halt
event may pause the execution of the machine while it is pouring. When a resume event occurs, the machine
remembers to resume pouring.
Using LabVIEW Statecharts
With the LabVIEW Statechart Module, you can design software components with a statechart diagram and define the
behavior of the states and transition logic with dataflow graphical programming. Use the LabVIEW Project Explorer to
fully integrate statecharts into the LabVIEW environment. Each LabVIEW statechart has several components that you
can use to configure the context of the design. Figure 5 shows an example statechart called LVStatechart 1.lvsc. You
can create triggers that correspond to transitions and state reactions as well as edit the list of input and output data
variables that the statechart uses.
Figure 5. An Example Statechart Called LVStatechart 1.lvsc
The Diagram.vi file contains the actual statechart diagram. Within this diagram, you create the states of the system
and the transitions between them. One of the main benefits of statecharts is how they visually represent the behavior
of the system and, therefore, self-document the software. Figure 6 shows a statechart that describes a packaging
machine. You can easily see the different states of a machine and the transitions between each state.
zone.ni.com/devzone/cda/tut/p/id/6194
4/7
2011-02-19
Developing Applications with the NI Lab…
[+] Enlarge Image
Figure 6. Statechart That Describ es a Packaging Machine
Statecharts are useful to describe reactive systems. You can design each state with multiple reactions that
correspond to a variety of triggers, or events, that are sent to the statechart from a hardware device or user interface.
The reactions are implemented with LabVIEW graphical programming. Figure 6 demonstrates the LabVIEW code that
executes when the system is in the “Producing” state and the trigger “Materials Low” occurs. The triggers can also
cause transitions to execute between states. An alternative way to determine transitions is to use LabVIEW code that
evaluates a guard. Guards describe conditions that have to be met to execute a transition. Figure 7 shows the guard
code for the transition labeled “Materials Runout.” The LabVIEW code ensures that the level has to be less than 35.5
to execute the transition from the “Producing” state to the “Standby” state.
[+] Enlarge Image
Figure 7. The Guard Code for the Transition Lab eled “Materials Runout”
zone.ni.com/devzone/cda/tut/p/id/6194
5/7
2011-02-19
Developing Applications with the NI Lab…
To meet the needs of different use cases, LabVIEW statecharts generate code for two execution modes: synchronous
and asynchronous. The synchronous mode is designed to describe the behavior of a controller with different states
that react to a set of I/O inputs that are updated at a constant rate. This mode is applicable to embedded control
systems such as engine control units (ECUs), motion controllers, and environmental controllers. The asynchronous
mode is designed to address applications with external events from an application. This is useful to program human
machine interfaces (HMIs) and model event-based systems and algorithms.
Demo: Example of a Synchronous Statechart
When you have determined the right execution mode for your statechart, you can generate executable code in the form
of a modular subVI, or function call. You can then call the subVI from within a LabVIEW dataflow diagram as shown in
Figure 7. You can visually debug the statechart through LabVIEW execution highlighting and through standard
debugging elements such as breakpoints, probes (variable watch windows), and single-stepping.
Demo: Statechart Debugging
You can generate statechart code for a variety of hardware platforms, including desktop systems, HMIs,
programmable automation controllers (PACs) such as NI CompactRIO and PXI, FPGAs on NI hardware, and any 32bit microprocessor. The ability to deploy statecharts to many hardware platforms makes the LabVIEW Statechart
Module an excellent design tool for the development and deployment of embedded systems. You also can use
statecharts with the LabVIEW Control Design and Simulation Module to model and evaluate hybrid systems using
dynamic system simulation.
Learn More about Using LabVIEW Statecharts to Program FPGAs
Benefits of Statecharts
Using LabVIEW statecharts for system design provides several benefits for software developers. Statecharts offer a
system-level view that describes the complete function of a system or application because a statechart diagram
captures each possible state of the system. Therefore, the use of statecharts helps reduce the possibility of software
“hangs” and other unexpected behavior because you are forced to consider every alternative to which the software
needs to respond. As this paper has discussed, the statechart programming model is especially useful for reactive
systems, which are characterized by how they respond to inputs. You can design a system so that it scales to handle
multiple state reactions and transitions based on any combination of events. Statecharts are similar to graphical
dataflow programs in that they are self-documenting and promote the easy transfer of knowledge between
developers. A new member of a design team can look at a statechart diagram and quickly grasp the elements of a
system.
Conclusion
The statechart model of computation offers a sophisticated way to tackle complex application development.
Statecharts are especially useful for programming event-response applications such as intricate user interfaces and
advanced state machines used to implement dynamic system controllers, machine control logic, and digital
communication protocols. With the new LabVIEW Statechart Module, you achieve the rapid development and tight
hardware integration of the LabVIEW platform. You can now add the statechart to your tool chest for programming
complex applications.
Related Links
LabVIEW Statechart Resource Page
White Paper: Using LabVIEW Statecharts to Program FPGAs
White Paper: Hybrid Control Systems with LabVIEW Statecharts and Control Design and Simulation Tools
OMG UML Resource Page
References
David Harel, Statecharts: A Visual Formalism for Complex Systems, Department of Applied Mathematics, The
Weizmann Institute of Science, 1986.
Reader Comments | Submit a comment »
zone.ni.com/devzone/cda/tut/p/id/6194
6/7
2011-02-19
Developing Applications with the NI Lab…
A nice start
I like this introduction to Statechart...It help me a lot to start working with this tool.
- matias_silvestrini@hotmail.com - Sep 8, 2008
Figure numbers?
Figures are referred to in the text, but there are no captions for the figures. In some cases they are above the
reference in the text, and in others below. A bit confusing unless you already are familiar with the terminology.
- Jan 29, 2008
A very comprehensive and meticulously explained demo.
The demo helped me understand the basic application of statecharts in LV. It was really a very good demo.
- vyomdev@gmail.com - Oct 9, 2007
Legal
This tutorial (this "tutorial") was developed by National Instruments ("NI"). Although technical support of this tutorial
may be made available by National Instruments, the content in this tutorial may not be completely tested and verified,
and NI does not guarantee its quality in any way or that NI will continue to support this content with each new revision
of related products and drivers. THIS TUTORIAL IS PROVIDED "AS IS" WITHOUT WARRANTY OF ANY KIND AND
SUBJECT TO CERTAIN RESTRICTIONS AS MORE SPECIFICALLY SET FORTH IN NI.COM'S TERMS OF USE
(http://ni.com/legal/termsofuse/unitedstates/us/).
My Profile | RSS | Privacy | Legal | Contact NI © 2011 National Instruments Corporation. All rights reserved.
zone.ni.com/devzone/cda/tut/p/id/6194
|
E-Mail this Page
7/7


