EE443L Lab 3: Open Versus Closed Loop Motor Speed Control )(t θx
advertisement

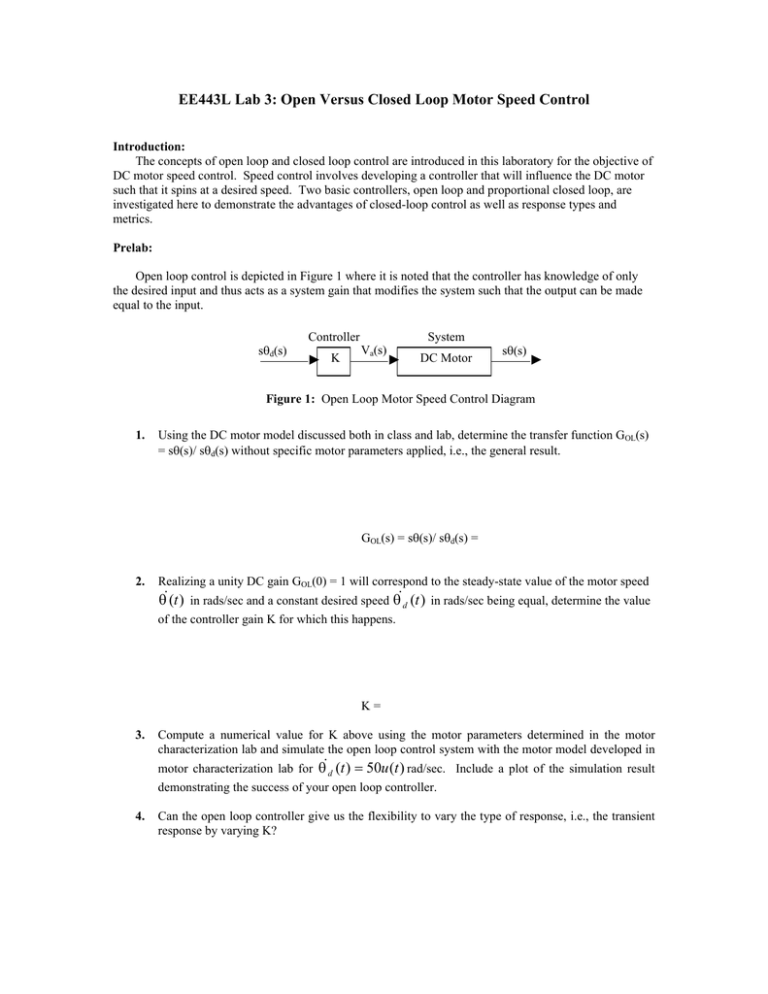
EE443L Lab 3: Open Versus Closed Loop Motor Speed Control Introduction: The concepts of open loop and closed loop control are introduced in this laboratory for the objective of DC motor speed control. Speed control involves developing a controller that will influence the DC motor such that it spins at a desired speed. Two basic controllers, open loop and proportional closed loop, are investigated here to demonstrate the advantages of closed-loop control as well as response types and metrics. Prelab: Open loop control is depicted in Figure 1 where it is noted that the controller has knowledge of only the desired input and thus acts as a system gain that modifies the system such that the output can be made equal to the input. Controller sθd(s) K System Va(s) DC Motor sθ(s) Figure 1: Open Loop Motor Speed Control Diagram 1. Using the DC motor model discussed both in class and lab, determine the transfer function GOL(s) = sθ(s)/ sθd(s) without specific motor parameters applied, i.e., the general result. GOL(s) = sθ(s)/ sθd(s) = 2. Realizing a unity DC gain GOL(0) = 1 will correspond to the steady-state value of the motor speed θ&(t ) in rads/sec and a constant desired speed θ&d (t ) in rads/sec being equal, determine the value of the controller gain K for which this happens. K= 3. Compute a numerical value for K above using the motor parameters determined in the motor characterization lab and simulate the open loop control system with the motor model developed in motor characterization lab for θ&d (t ) = 50u (t ) rad/sec. Include a plot of the simulation result demonstrating the success of your open loop controller. 4. Can the open loop controller give us the flexibility to vary the type of response, i.e., the transient response by varying K? Proportional closed loop control is depicted in Figure 2 where it is noted that the controller has knowledge of both the desired input and system output. Thus, the DC motor input voltage Va(s) is varied based on the difference (error) between the desired speed sθd(s) and actual speed sθ(s). sθd(s) + Controller E(s) K _ System Va(s) DC Motor sθ(s) Figure 2: Proportional Closed Loop Motor Speed Control Diagram 5. Using the DC motor model discussed both in class and lab, determine the transfer function GCL(s) = sθ(s)/ sθd(s) without specific motor parameters applied, i.e., the general result. GCL(s) = sθ(s)/ sθd(s) = 6. Realizing a unity DC gain GCL(0) = 1 will correspond to the steady-state value of the motor speed θ&(t ) in rads/sec and a constant desired speed θ&d (t ) in rads/sec being equal, determine the value of the controller gain K for which this happens. Is this value physically realizable? K= 7. Can the closed loop controller give us the flexibility to vary the type of response, i.e., the transient response by varying K? Why or why not? 8. With the help of Matlab, Maple, or Simulink, find sample values of K that will yield overdamped and underdamped responses for θ&d (t ) = 50u (t ) rad/sec using the motor parameters determined in the motor characterization lab. Simulate the system with Simulink and turn in plots of your overdamped and underdamped responses. Laboratory Procedure: H-Bridge Voltage Drop The DC motor under study will be actuated via a pulse-width-modulated (PWM) armature voltage switched on and off via parallel LMD18200T h-bridges as shown in Figure 3. The varying nature of the PWM input makes it very difficult to measure the effective input voltage of the motor. Therefore, it is important to know how much voltage is dropped across the h-bridges, so that the armature voltage can be precisely varied through duty cycle in control algorithms. 1. Set the supply voltages to 13V, 14V, and 15V, and plot the motor voltage for each modifying the LabVIEW VI from lab 2 to take the measurements. 2. Note that the h-bridge dropout voltage is the difference between the supply voltage and motor voltage. Compute the average of the three values obtained. 3. Remember that the effective voltage across the motor is the supply voltage minus the h-bridge dropout voltage, i.e., VMOTOR = VSUPPLY - VDROPOUT + VSUPPLY + Motor Voltage Divider Frequency to Voltage Converter (~14.4kHz / 3.5V)_ ACH1 VMOTOR / 2 _ Encoder 10kΩ DC Motor _ ACH0 + VVELOCITY _ ACH9 10kΩ + GPCTR0_OUT, PWM Parallel LMD18200 T H-Bridges VDROPOUT _ Figure 3: DC Motor Experiment Setup Open Loop Control Open loop control will be implemented through the approach shown in Figure 1 and discussed in the prelab. 1. Begin the lab by downloading the LabVIEW VI lab3.vi found at N:/EE443L/LAB3/ that is set up to vary the PWM duty cycle through a virtual knob. Ensure you understand the operation of the VI and that it correctly drives the motor when the supply voltage is set to 14V. 2. Add analog signal collection to the VI for motor velocity measurements as well as the open loop control approach of Figure 1 that varies the PWM duty cycle. There are many different ways of implementing this, so it may be helpful to look through the various examples in LabVIEW as well as chapters 6 and 7 of the LabVIEW Data Acquisition Basics Manual. 3. Use open loop control and the open loop gain K determined in the prelab to provide DC motor speed control. Plot the motor response and compare to the simulink results for θ&d (t ) = 50u (t ) rads/sec. Note several conversions will need to be done in the open loop controller such as armature voltage to duty cycle with the h-bridge drop out included or frequency-to-voltage converter voltage to actual speed. Include a printout of your LabVIEW open loop control VI. 4. Adjust the open loop gain K, so θ&d (t ) = θ&(t ) and plot response. Measure the response peak time Tp, percent overshoot P.O., settling time Ts, rise time Tr, and steady state error ess as shown in Figure 4 and discussed in Table 1. θ&(t ) (rad/sec) Overshoot ess θ&d θ&ss ± 2% of θ&ss 0.9θ&ss 01 . θ&ss Tr 0 0 Tp Ts Figure 4: Performance Metrics for Control System Step Responses Table 1: Description of Step Response Performance Metrics Performance Metric Tp (peak time) P.O. (percent overshoot) Ts (settling time) Tr (rise time) ess (steady state error) Description time for response to rise to a peak (maximum) 100%(peak value - steady state value) / steady state value time required for response to settle within ± 2% of its steady state value time for response to rise from 10% to 90% of its steady state value difference between desired and actual responses after transients have decayed Closed Loop Control Topic of next laboratory (Lab 4). t (sec)


