P r o d u c t
N o t e
Thermogravimetric Analysis –
Infrared Spectroscopy
• Complete system from a single
supplier to measure evolved gases
• Allows IR measurement of gases
evolved from the TGA
• Engineered solution for gas transfer,
delivering high sensitivity and
precise control
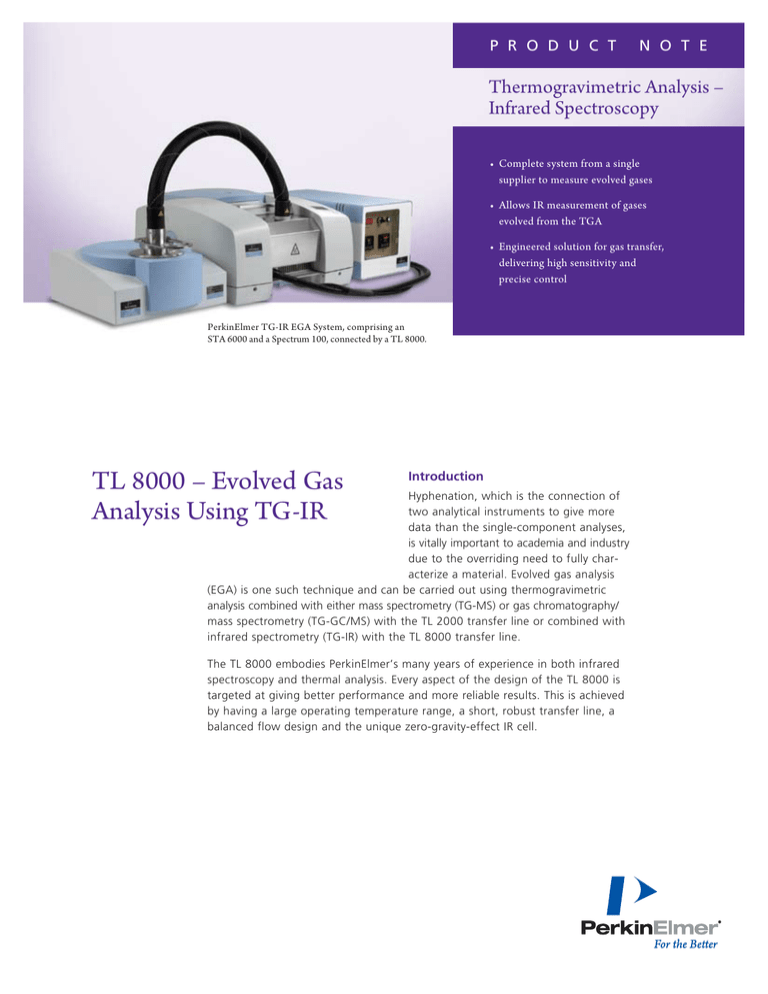
PerkinElmer TG-IR EGA System, comprising an
STA 6000 and a Spectrum 100, connected by a TL 8000.
TL 8000 – Evolved Gas
Analysis Using TG-IR
Introduction
Hyphenation, which is the connection of
two analytical instruments to give more
data than the single-component analyses,
is vitally important to academia and industry
due to the overriding need to fully characterize a material. Evolved gas analysis
(EGA) is one such technique and can be carried out using thermogravimetric
analysis combined with either mass spectrometry (TG-MS) or gas chromatography/
mass spectrometry (TG-GC/MS) with the TL 2000 transfer line or combined with
infrared spectrometry (TG-IR) with the TL 8000 transfer line.
The TL 8000 embodies PerkinElmer’s many years of experience in both infrared
spectroscopy and thermal analysis. Every aspect of the design of the TL 8000 is
targeted at giving better performance and more reliable results. This is achieved
by having a large operating temperature range, a short, robust transfer line, a
balanced flow design and the unique zero-gravity-effect IR cell.
Large Temperature Range
The IR Cell
While most TG-IR systems offer temperatures up to 300 C,
the TL 8000 boasts a maximum temperature of 350 oC for
both the transfer line and the cell. The benefit of this is
two-fold:
o
1.Enables heavy, high-boiling-point products such as flame
retardants to travel through the system without the issues
of condensation and deposition.
2.Gives peace of mind that in between runs a higher
temperature can be used to burn off the system,
preventing cross contamination.
The Transfer Line
Unlike some other transfer lines available which are easily
deformed, the TL 8000 has a SilcoSteel®-coated copper tube
wrapped with heating coils surrounded with insulation and
a tough outer coating, ensuring robustness. A short line
length of 1 m also means that the time lag between the two
instruments is minimized, improving time resolution and
dramatically reducing the probability of products condensing.
The tube is also replaceable for cleaning, if required.
The design of the IR cell is critical to the performance of
the system. The cell has a path-length of 100 mm, which
allows for high sensitivity without requiring a large volume.
The small volume of 11.3 cm3 improves time resolution and
reduces the cleaning times between runs, therefore increasing
productivity. The ability to purge the spectrometer sample
compartment means that atmospheric absorption is minimized
and, furthermore, the cell has the flexibility of using either
standard KBr windows or ZnSe, if moisture resistance is
required. The cell inlet and outlet ports are designed to
ensure that heavy components are passed through the
cell efficiently. With conventional cells, heavy fractions of
evolved gas can accumulate in the cell (Figure 2B), thus
compromising the time resolution of the signal. With the
zero-gravity-effect cell (Figure 2A), the downward-facing
outlet ensures that this does not occur.
Balanced Flow
Balanced flow means that throughout the system, gas flow
and temperature are both monitored and regulated. This is
carried out by a mass flow controller and a filtration system
contained in the controller box. Together with the constant
gas temperature provided by the line and cell heaters, the
resulting effect is that constant gas pressure and rate can
be maintained throughout the system. The consequence
of this is better separation of evolved products, leading to
much clearer spectra and better time-resolved data. Figure 1
shows a Gram Schmidt profile (derived from IR plots) of
ethylvinylacetate (EVA) heating at 20 oC/min from 50 to
650 oC, highlighting the sharp time-resolved data.
Figure 2. Graphical representation showing the zero gravity cell (A) and the
build-up of heavy fractions in an ordinary IR cell (B).
Software
The TL 8000 system is controlled by two powerful pieces
of software. Pyris™ Software controls the thermal analysis
instrument, allowing desired thermal programs to be
specified as well as automated triggering of the IR software
(a representative method is shown in Figure 3 – Page 3).
Figure 1. Gram Schmidt profile for EVA heated at 20 oC/min between 50 and
650 oC recorded using the TL 8000.
2
Figure 3. Method Editor window from Pyris Software showing a heating
regime with the triggering functionality enabled.
Figure 5. Data Collection Setup window for Spectrum TimeBase Software.
The full manipulation of thermal curves produced is also
available in Pyris Software with an example of the thermal
data produced by the TL 8000 shown in Figure 4. The data
was collected on heating ethylene vinyl acetate from 30 to
600 oC at 20 oC/min. The data in blue shows the weight
change on heating, indicating two weight-loss events.
The derivative weight loss is also presented in red.
TimeBase allows for full manipulation of the IR data including
Gram-Schmidt plots, individual functional group data, as
well as individual spectra recorded during the run. Pyris data
can also be exported into TimeBase as the raw data (Figure 6),
or as the derivative plot. The plots in Figure 7 (Page 4) show
the imported Pyris data for EVA (Figure 4) on the bottom
in blue along with the Gram-Schmidt thermogram derived
from the infrared absorbance and shown in red. This feature
allows easy comparison of the data from the two instruments,
and here it can be seen that the two periods of weight
loss are associated with absorption by the evolved gases.
TimeBase also allows construction of profiles corresponding
to intensity of individual spectral bands and even quantitative
Beer’s Law or chemometric models.
Figure 4. TGA plot showing EVA heating from 30 to 600 oC at 20 oC/min
shown in blue with the derivative shown in red.
The second piece of software is Spectrum™ TimeBase™,
which allows for time-resolved IR experiments. TimeBase
waits for a trigger from Pyris (supplied via a relay box) by
a simple tick box (Figure 5).
Figure 6. Weight-loss curve (blue) and Gram-Schmidt thermogram (red) for
EVA recorded at 20 oC/min between 30 and 600 oC.
3
The system is also supplied with PerkinElmer® Spectrum software, which allows sophisticated processing and analysis of
the individual infrared spectra, such as library searching and
comparison against reference spectra. As shown in Figure 7,
the first peak in the Gram-Schmidt thermogram corresponds
to acetic acid (and a small amount of CO2). The second peak
in the thermogram occurs as the polymer backbone breaks
down, giving (in the nitrogen atmosphere) soot and aliphatic
hydrocarbons (Figure 8).
Compatibility
The TL 8000 system is compatible with the PerkinElmer
Pyris 1 TGA, STA 6000 and TGA 4000 thermal analyzers
and PerkinElmer’s Spectrum 100 series of IR spectrometers
including Spectrum One, Spectrum NTS, Spectrum 65,
Spectrum 100, Spectrum 100N, Spectrum 400.
Conclusion
Design features such as balanced flow and the unique IR cell
mean that the TL 8000 evolved gas analysis system gives the
highest quality and most reliable results of any TG-IR system
on the market.
To learn more about TG-IR or other hyphenated
technology, visit www.perkinelmer.com/hyphenation
Figure 7. Comparison of the infrared spectrum recorded at 991.8 s (362.3 °C)
with a reference acetic-acid spectrum. The identification is unambiguous, and
the Compare function returns a correlation of 0.99, indicating excellent
agreement. (The doublet around 2150 cm-1 is due to CO2 in the evolved gas.)
Figure 8. The infrared spectrum recorded at 1364.5 s (477.2 °C) shows that
the polymer backbone degrades to give soot and long-chain hydrocarbons.
PerkinElmer, Inc.
940 Winter Street
Waltham, MA 02451 USA
P: (800) 762-4000 or
(+1) 203-925-4602
www.perkinelmer.com
For a complete listing of our global offices, visit www.perkinelmer.com/ContactUs
Copyright ©2009, PerkinElmer, Inc. All rights reserved. PerkinElmer® is a registered trademark of PerkinElmer, Inc. All other trademarks are the property of their respective owners.
008943_01


