Digitizing Polygons with ArcView 3.2 Using the Summagraphics
advertisement
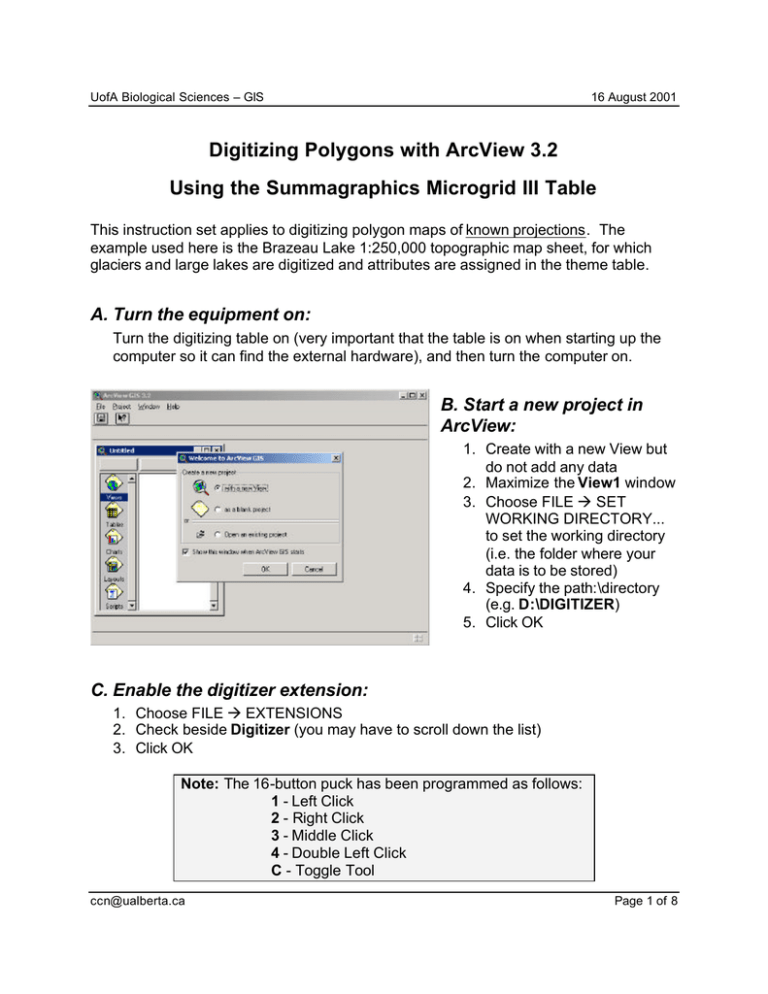
UofA Biological Sciences – GIS 16 August 2001 Digitizing Polygons with ArcView 3.2 Using the Summagraphics Microgrid III Table This instruction set applies to digitizing polygon maps of known projections. The example used here is the Brazeau Lake 1:250,000 topographic map sheet, for which glaciers and large lakes are digitized and attributes are assigned in the theme table. A. Turn the equipment on: Turn the digitizing table on (very important that the table is on when starting up the computer so it can find the external hardware), and then turn the computer on. B. Start a new project in ArcView: 1. Create with a new View but do not add any data 2. Maximize the View1 window 3. Choose FILE à SET WORKING DIRECTORY... to set the working directory (i.e. the folder where your data is to be stored) 4. Specify the path:\directory (e.g. D:\DIGITIZER) 5. Click OK C. Enable the digitizer extension: 1. Choose FILE à EXTENSIONS 2. Check beside Digitizer (you may have to scroll down the list) 3. Click OK Note: The 16-button puck has been programmed as follows: 1 - Left Click 2 - Right Click 3 - Middle Click 4 - Double Left Click C - Toggle Tool ccn@ualberta.ca Page 1 of 8 UofA Biological Sciences – GIS 16 August 2001 D. Set the View Properties The following pertains to digitizing in the UTM NAD83 projection/datum; simply substitute the appropriate information for your particular projection/datum. 1. Choose VIEW à PROPERTIES 2. Set the following units to correspond to UTM: • Map Units = meters • Distance Units = meters 3. Click OK Note: If you set the projection at this time, the digitized map will be stored in decimal degrees. By not setting the projection, the data is stored as the original paper map units. See ArcView Help for more information on setting projections in the View Properties while digitizing. E. Enter the registration control points for the tic Id#'s: 1. 2. 3. 4. 5. Choose VIEW à DIGITIZER SETUP... Click in the X Coordinate cell and type the tic Id#1 X value Tab to the Y Coordinate cell and type the tic Id#1 Y value Tab to the next tic Id# cells and continue entering the corners of your map Click on Id#1 to highlight that row when you are finished entering values Example Brazeau_tic.txt file of X and Y coordinates: ccn@ualberta.ca Page 2 of 8 UofA Biological Sciences – GIS 16 August 2001 "Tic#","X","Y" 1,430000.00,5760000.00 2,570000.00,5760000.00 3,570000.00,5870000.00 4,430000.00,5870000.00 It’s a good idea to have your list if tic Ids handy for input. F. Save your tic file for future use: 1. 2. 3. 4. Click Save... Navigate to your working directory (e.g. D:\DIGITIZER) Enter a name for your file (e.g. Brazeau_tic.txt) Click OK G. Set the theme extent: Zoom to the extent of your registration coordinates by creating a table from the saved tic file and making an event theme from that table. 1. Close the View1 window 2. In the Project Menu choose PROJECT à ADD TABLE... 3. Select Delimited Text for file type 4. Select the Brazeau_tic.txt file and click OK 5. Open View1 6. Choose VIEW à ADD EVENT THEME... 7. Select the XY button if the XY Event panel is not already displayed. 8. Select the tic table from the Table list 9. Click OK (because ArcView will fill in the X field and Y fields) 10. Highlight the Brazeau_tic.txt theme 11. Click on the Zoom to Active Theme(s) icon H. Register the paper map: 1. Back in the Digitizer Setup… window make sure tic Id#1 in the list is highlighted 2. Place the digitizing puck crosshairs over tic Id#1 and press 1 on the puck 3. Place the digitizing puck crosshairs over the next tic Id# and press 1 on the puck, continuing until all four corners of your map have been registered ccn@ualberta.ca Page 3 of 8 UofA Biological Sciences – GIS 16 August 2001 4. Compare the Calculated Error to the Error Limit (you may also change the limit or re-register the tics by highlighting them in the list and re-digitizing) 5. Click Register when the calculated error is less than the error limit Note: Make sure the digitizer is in “puck mode” by choosing VIEW à DIGITIZER AS PUCK (F2 toggles back and forth from mouse to puck mode). If the menu says DIGITIZER AS MOUSE then you are already in puck mode. I. Define the stream tolerance and enable/disable stream mode: Stream tolerance is the number of nodes (points) per map unit length that ArcView uses to draw a shape. 1. Choose VIEW à STREAM TOLERANCE 2. Enter 50 and click OK (this means ArcView will place nodes every 50 meters along the polyline that you trace from the paper map) 3. Choose VIEW à DISABLE STREAM MODE (or ENABLE– press F3 to toggle) Note: Snapping tolerance is the distance a polyline can be within to be considered connected to another. Stream mode enabled allows you to trace along the polyline to digitize it (much faster – but requires a steady hand). If this mode is disabled, you must click at each node and vertex as you follow along the shape. See below for more on stream mode (and ArcView Help for more on snapping tolerance). J. Digitize the polygon map (stream mode disabled): 1. Choose VIEW à NEW THEME... 2. Select Polygon as the Feature type and click OK 3. Enter a Name.shp for the new theme and click OK ccn@ualberta.ca Page 4 of 8 UofA Biological Sciences – GIS 16 August 2001 4. Click on it to make sure this is the only theme highlighted 5. Choose THEME à PROPERTIES 6. Select Editing 7. Check General for Snapping 8. Enter 5 m for the Tolerance 9. Click OK 10. Click on the Draw Polygon icon 11. Place the digitizing puck crosshairs over the starting node and press 1 12. Place the digitizing puck crosshairs over the next vertex and press 1 13. Continue until all vertices of your polygon have been digitized 14. Press 4 to close the polygon when you return back to the starting node 15. Choose THEME à STOP EDITING 16. Click Yes to save edits to your theme 17. Choose THEME à CLEAR SELECTED FEATURES 18. Select the Select Feature icon (This tool selects polygons and is useful when you want to interactively highlight a particular polygon in the table.) Note: This instruction set considers separate polygons (e.g. lakes and glaciers). See below for the many ways to digitize contiguous polygons. K. Assign IDs and attribute data to the theme table: 1. Choose THEME à TABLE 2. Choose TABLE à START EDITING 3. Select the Edit tool 4. Click in the first cell under the ID field 5. Enter a unique number (e.g. 1) and press Enter 6. Continue entering IDs in each cell and press Enter 7. Choose EDIT à ADD FIELD... 8. Define the new field according to the attribute data you want to enter (e.g. Name: "Code", Type: "String", Width: "2") 9. Click OK 10. Click in the first cell under the new field (e.g. Code) 11. Enter the attribute information (e.g. gl – glacier or lk – lake) and press Enter 12. Continue entering data in each cell and press Enter after each 13. Choose TABLE à STOP EDITING 14. Click Yes to save edits to your table ccn@ualberta.ca Page 5 of 8 UofA Biological Sciences – GIS 16 August 2001 More on stream mode: Stream mode allows you to trace along the polyline as you digitize; vertices are placed at a distance you specify under Stream Tolerance, yielding a smoother looking polygon (map on right). If this mode is disabled, you must click at each vertex as you follow along the shape, yielding a blockier looking polygon (map on left). VERTICES The many ways to digitize contiguous polygons: The above example instructs you on how to digitize separate polygons. For continuous area coverage maps, the polygons will be connected to each other, as in habitat or land cover maps. Use the Draw Rectangle tool to draw the first polygon to encompass all others. Subsequent polygons can be digitized using the Draw Polygon tool (for “islands”), and the Split Polygon tool to split a preexisting polygon into smaller ones, or the Append Polygon tool to draw another polygon adjacent to a preexisting one. Stream Mode DISABLED: Choose VIEW à DISABLE STREAM MODE (F3 will also toggle this mode) a) b) c) d) DRAW RECTANGLE Place cursor crosshair over one corner Press 1 Drag cursor diagonally until crosshair is over the opposite corner Press 4 (This is shown in the Brazeau map below for Zones.) ccn@ualberta.ca Page 6 of 8 UofA Biological Sciences – GIS a) b) c) d) e) f) a) b) c) d) e) f) g) a) b) c) d) e) f) g) 16 August 2001 DRAW POLYGON Place cursor crosshair over starting vertex Press 1 Place cursor over next vertex Press 1 Continue moving and pressing 1 until you return to starting vertex Press 4 to close polygon SPLIT POLYGON Place cursor crosshair over starting node just outside the preexisting polygon that you want split Press 1 Place cursor over next vertex Press 1 Continue moving and pressing 1 until you get to just outside the other side of the polygon for the ending node Press 1 Press 4 to finish (This is shown in the Brazeau map below for Zones.) APPEND POLYGON Place cursor crosshair over starting node just inside the preexisting polygon that you want to append to Press 1 Place cursor over next vertex Press 1 Continue moving and pressing 1 until you get to just inside the other polygon for the ending node Press 1 Press 4 to finish Stream Mode ENABLED: To enable stream mode, do the following: a) Choose VIEW à STREAM TOLERANCE... b) Enter 50 (or another value appropriate to your map) c) Click OK d) Choose VIEW à ENABLE STREAM MODE (F3 will also toggle this mode) e) Choose THEME à PROPERTIES f) Select Editing g) Check General for Snapping h) Enter 5 m for the Tolerance (or another value appropriate to your map) i) Click OK ccn@ualberta.ca Page 7 of 8 UofA Biological Sciences – GIS a) b) c) d) a) b) c) d) e) 16 August 2001 DRAW POLYGON Place cursor crosshair over starting vertex Press 1 Trace cursor along polygon until you return to starting vertex Press 4 to close polygon (This is shown in the Brazeau map below for Features.) SPLIT POLYGON Place cursor crosshair over starting node just outside the preexisting polygon that you want split Press 1 Trace cursor along polyline until you get to just outside the other side of the polygon for the ending node Press 1 Press 4 to finish (This is shown in the Brazeau map below for Zones.) APPEND POLYGON a) Place cursor crosshair over starting node just inside the preexisting polygon that you want to append to b) Press 1 c) Trace cursor along polyline until you get to just inside the other polygon for the ending node d) Press 1 e) Press 4 to finish Example map of digitized polygons: ccn@ualberta.ca Page 8 of 8
