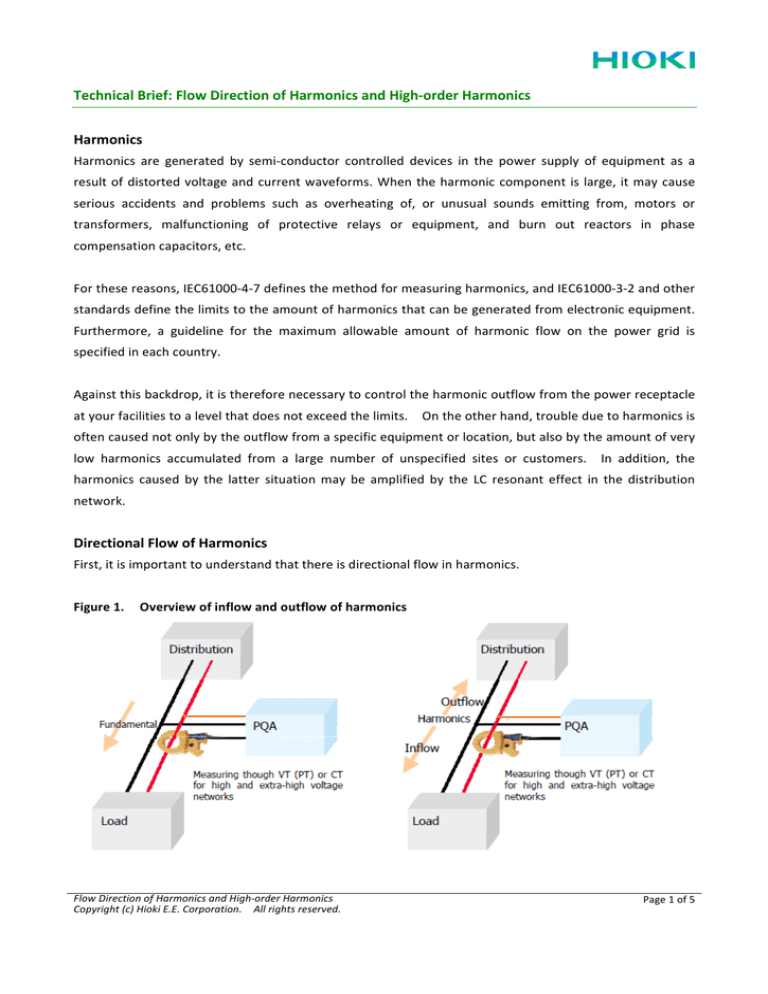
Technical Brief: Flow Direction of Harmonics and High-­‐order Harmonics Harmonics Harmonics are generated by semi-­‐conductor controlled devices in the power supply of equipment as a result of distorted voltage and current waveforms. When the harmonic component is large, it may cause serious accidents and problems such as overheating of, or unusual sounds emitting from, motors or transformers, malfunctioning of protective relays or equipment, and burn out reactors in phase compensation capacitors, etc. For these reasons, IEC61000-­‐4-­‐7 defines the method for measuring harmonics, and IEC61000-­‐3-­‐2 and other standards define the limits to the amount of harmonics that can be generated from electronic equipment. Furthermore, a guideline for the maximum allowable amount of harmonic flow on the power grid is specified in each country. Against this backdrop, it is therefore necessary to control the harmonic outflow from the power receptacle at your facilities to a level that does not exceed the limits. On the other hand, trouble due to harmonics is often caused not only by the outflow from a specific equipment or location, but also by the amount of very low harmonics accumulated from a large number of unspecified sites or customers. In addition, the harmonics caused by the latter situation may be amplified by the LC resonant effect in the distribution network. Directional Flow of Harmonics First, it is important to understand that there is directional flow in harmonics. Figure 1. Overview of inflow and outflow of harmonics Flow Direction of Harmonics and High-­‐order Harmonics Copyright (c) Hioki E.E. Corporation. All rights reserved. Page 1 of 5 Condition Cause Harmonics flow from Reason is very likely to be attributed to the distribution side Inflow distribution to load (Harmonics generated by distribution is bigger than harmonics generated by load.) Harmonics flow from Reason is very likely to be attributed to the load side Outflow load to distribution (Harmonics generated by load is bigger than harmonics generated by distribution.) Because harmonic is a vector containing amplitude and phase components, if there are multiple harmonics, you will not be able to determine the source solely from the flow direction. In fact, almost all power supplies contain harmonics, so it is difficult to determine the origin of the harmonic simply by looking at the inflow and outflow. In fact, it is necessary to look at various sources such as the time period to detect questionable equipment operation (run/stop), harmonic level, and harmonic inflow/outflow to investigate the effect of that equipment. Generally, you can determine inflow or outflow according to the harmonic voltage-­‐current phase difference, i.e., the difference between the harmonic voltage phase angle and the harmonic current phase angle. For 3-­‐phase circuits, using the sum value of the harmonic voltage-­‐current phase difference is recommended. If the sum is -­‐90° to +90°, the harmonic is judged as “inflow”. If the sum is -­‐180° to -­‐90° or +90° to +180°, the harmonic is judged as “outflow”. Figure 2. Harmonic voltage-­‐current phase angle difference Inflow -­‐90° to 0° to +90° Outflow -­‐180° to -­‐90°, +90° to +180° Flow Direction of Harmonics and High-­‐order Harmonics Copyright (c) Hioki E.E. Corporation. All rights reserved. Page 2 of 5 The following are examples of inflow/outflow judgement using the trend data of the phase angle difference of the harmonic voltage-­‐current. The fundamental wave (brown) is consumption (inflow) as shown in Figure 3. Most of the 5th harmonic (green) is also inflow. th
Figure 3. Time Plot of Harmonic Voltage-­‐Current Phase Difference (fundamental and 5 harmonic) The 3rd harmonic (red) is outflow as shown in Figure 4. The 7th harmonic (blue) is outflow. The data shows with the vertical lines that the phase difference exceeds 180° and returns to -­‐180° (or vice versa). rd
th
Figure 4. Time Plot of Harmonic Voltage-­‐Current Phase Difference (3 and 7 harmonics) Flow Direction of Harmonics and High-­‐order Harmonics Copyright (c) Hioki E.E. Corporation. All rights reserved. Page 3 of 5 In actual data analysis, it is recommended to measure the harmonic for a long duration and observe the amplitude level of the harmonic current to see if it is high or exceeds the limit. Then, while considering the operating status of the equipment, make an assumption regarding the source of the harmonic. Chart the start/stop time of the suspected equipment, and compare the harmonic level as well as the correlation between the inflow and outflow of the harmonic voltage-­‐current phase angle difference to make a clear determination. High-­‐order Harmonics In recent years, problems caused by frequency noise higher than the 50th order harmonic are being seen. Although noise at this frequency bandwidth may be attributed to a very low level source, amplification by resonant phenomena will nevertheless lead to issues. Usually, noise, including voltage fluctuation, generated by equipment or typically the equipment’s power supply is regulated by IEC61000-­‐3-­‐3 (flicker), IEC61000-­‐3-­‐2 (harmonics), and IEC61000-­‐3-­‐12 (THD), etc., but standards are specified only up to the 40th order (2kHz at 50Hz fundamental). Also, frequency regulated by EMC standards, such as power supply terminal emission voltage by CISPR 22/EN55022, etc., targets frequencies 150kHz or higher, so there are no standards for noise in the 10’s of kHz range. The HIOKI PW3198 can measure frequency components between 2kHz and 80kHz as high-­‐order harmonics. Case Study: High-­‐order Harmonics from LED Lighting One case study involving such noise was the detection of unusual sounds emitted from LED lighting in a new building. No critical harmonics up to the 50th order was found, but instead a rather high amplitude of high-­‐order harmonics was detected. After connecting to a power source from another network, the unusual sound stopped, leading to the assumption that the high-­‐order harmonic amplified by resonance was the cause. Figure 5. Recording example by PW3198 (trend plot of high-­‐order harmonic current, voltage & current waveforms) Flow Direction of Harmonics and High-­‐order Harmonics Copyright (c) Hioki E.E. Corporation. All rights reserved. Page 4 of 5 RELEVANT HIOKI PRODUCTS PW3198 Power Quality Analyzer !
Certified IEC61000-­‐4-­‐30 Class A !
Simultaneous trend recording and event detection by threshold for various values including harmonics up to 50th order, THD and high-­‐order harmonics !
!
Large 2GB SD card data storage 2MHz dedicated sampling for transient overvoltage which is very fast phenomena in order to capture peak value and duration with waveform PW3360-­‐21 Clamp On Power Logger !
Compact power logger with harmonic recording up to the 40th order !
Large 2GB SD card data storage Flow Direction of Harmonics and High-­‐order Harmonics Copyright (c) Hioki E.E. Corporation. All rights reserved. Page 5 of 5

