Investor Fact Sheet
First Quarter Fiscal Year 2012
Company Overview
Analog Devices (NYSE: ADI) is
a world leader in the design,
manufacture, and marketing
of a broad portfolio of high performance analog, mixed-signal,
and digital signal processing (DSP)
integrated circuits (ICs) used in
virtually all types of electronic
equipment. Since our inception
in 1965, we have focused on
solving the engineering challenges associated with signal
processing in electronic equipment. Used by over 60,000 customers
worldwide, our signal processing products play a fundamental role
in converting, conditioning, and processing real-world phenomena
such as temperature, pressure, sound, light, speed, and motion into
electrical signals to be used in a wide array of electronic devices.
We focus on key strategic markets where our signal processing technology is often a critical differentiator in our customers’
products, namely the industrial, automotive, communications, and
consumer markets.
We currently produce a wide range of innovative products—including
data converters, amplifiers and linear products, radio frequency (RF)
ICs, power management products, sensors based on microelectromechanical systems (MEMS) technology and other sensors, and
processing products, including DSP and other processors—that are
designed to meet the needs of our broad base of customers. The largest
percentage of our revenue comes from our data converter products.
A majority of analysts who cover the converter market estimate our
market share to be between 40% and 47.5%,* and we are well recognized as the leader in this product area in every region of the world.
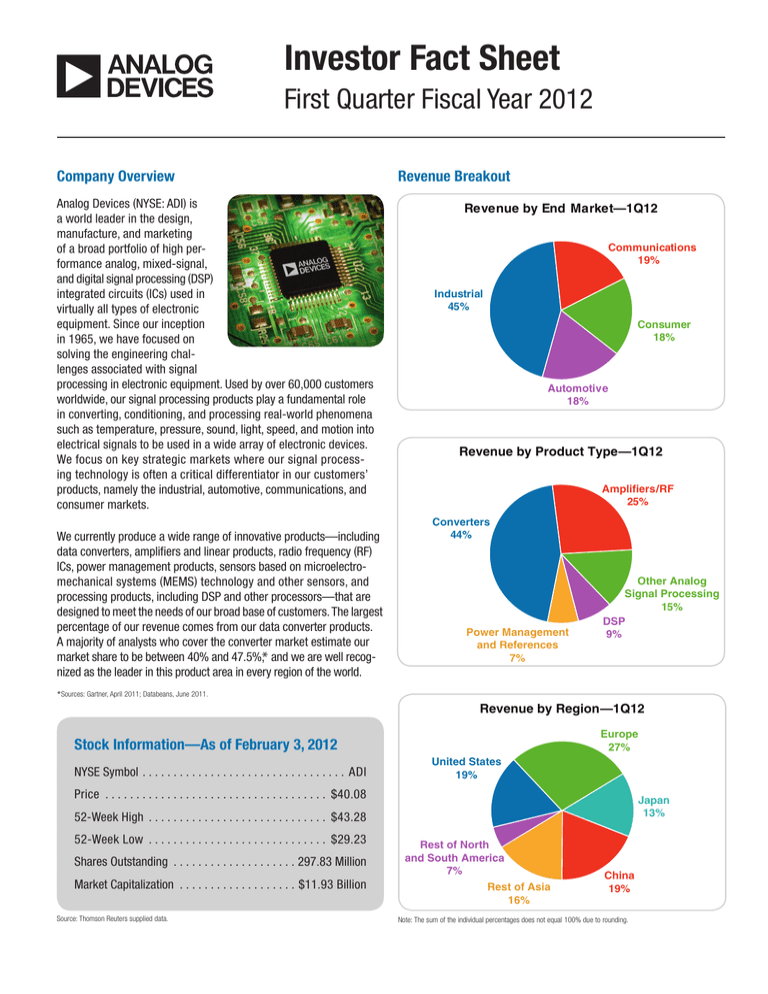
Revenue Breakout
Revenue by End Market—1Q12
Communications
19%
Industrial
45%
Consumer
18%
Automotive
18%
Revenue by Product Type—1Q12
Amplifiers/RF
25%
Converters
44%
Power Management
and References
7%
Other Analog
Signal Processing
15%
DSP
9%
*Sources: Gartner, April 2011; Databeans, June 2011.
Revenue by Region—1Q12
Europe
27%
Stock Information—As of February 3, 2012
NYSE Symbol. . . . . . . . . . . . . . . . . . . . . . . . . . . . . . . . . . ADI
United States
19%
Price . . . . . . . . . . . . . . . . . . . . . . . . . . . . . . . . . . . . . $40.08
Japan
13%
52-Week High . . . . . . . . . . . . . . . . . . . . . . . . . . . . . . $43.28
52-Week Low . . . . . . . . . . . . . . . . . . . . . . . . . . . . . . $29.23
Shares Outstanding . . . . . . . . . . . . . . . . . . . . . 297.83 Million
Market Capitalization . . . . . . . . . . . . . . . . . . . . $11.93 Billion
Source: Thomson Reuters supplied data.
Rest of North
and South America
7%
Rest of Asia
16%
China
19%
Note: The sum of the individual percentages does not equal 100% due to rounding.
Financial Highlights
Quarterly Financial Performance
(In Millions Except Per Share Amounts)
FY2011
FY2010
FY2009
FY2008
Revenue from Continuing
Operations ($M)*
FY2007
Income Statement
Total Revenue from Continuing
$2,993.3 $2,761.5 $2,014.9 $2,582.9 $2,464.7
Operations
Gross Margin
Operating Income from
Continuing Operations
66.4%
65.2%
55.5%
61.1%
61.2%
$1,072.0
$900.1
$284.8
$625.0
$568.7
Operating Margin
35.8%
32.6%
14.1%
24.2%
23.4%
Net Income from Continuing
Operations
$860.9
$711.2
$247.4
$525.2
$502.1
Earnings per Diluted Share
from Continuing Operations
$2.79
$2.33
$0.85
$1.77
$1.51
Dividends Declared per
Common Share
$0.94
$0.84
$0.80
$0.76
$0.70
$800
$700
$600
$500
$400
$300
$200
$100
$0
1Q11
70%
Cash and Short-Term
Investments
$3,592.5 $2,687.8 $1,816.0 $1,309.7 $1,081.2
65%
Total Assets
$5,277.6 $4,328.8 $3,369.4 $3,081.1 $2,967.3
$886.4
$400.6
$379.6
—
—
2Q11
$758
3Q11
$716
4Q11
$648
1Q12
66.2%
67.6%
67.2%
64.3%
63.2%
60%
55%
50%
Cash Flow Statement
Net Cash Provided by
Operating Activities
$791
Gross Margins as a
Percentage of Sales*
Balance Sheet
Long-Term Debt
$729
$900.5
$991.2
$432.1
$669.4
$820.4
45%
40%
1Q11
2Q11
3Q11
4Q11
1Q12
Research Coverage
• Argus Research Co.
• Bank of America/
Merrill Lynch
• Barclays Capital
• Bernstein Research
• BMO Capital Markets
• Canaccord Genuity
• Caris & Company
• Citigroup
• Cleveland Research Co.
• Credit Suisse
• Deutsche Bank
• Goldman Sachs & Co.
• ISI Group
•
•
•
•
•
•
•
•
•
•
•
•
•
•
J.P. Morgan
Jefferies & Co.
Macquarie Research
MKM Partners LLC
Morgan Keegan
Morningstar, Inc.
Nomura Securities Intl.
Pacific Crest Securities
Raymond James
RBC Capital Markets
Robert W. Baird & Co., Inc.
Sterne, Agee & Leach, Inc.
UBS
Wells Fargo Securities
Operating Margin from Continuing Operations
as a Percentage of Sales
40%
35.6%
ADI Corporate Headquarters
Analog Devices, Inc.
One Technology Way
Norwood, MA 02062
Phone: 781-329-4700
www.analog.com
Investor Relations
Email: investor.relations@analog.com
Phone: 781-461-3282
investor.analog.com
32.9%
28.3%
30%
25%
20%
15%
10%
5%
0%
1Q11
2Q11
3Q11
4Q11
1Q12
Non-GAAP Diluted EPS
from Continuing Operations
$0.70
Investor Relations
36.8%
35%
$0.75
$0.80
Contact Information
37.8%
$0.66
$0.71
$0.60
$0.60
$0.46
$0.50
$0.40
$0.30
$0.20
$0.10
$0.00
*1Q11
*2Q11
3Q11
4Q11
1Q12
*Includes non-GAAP figures, which are reconciled to their most directly comparable GAAP
figures on ADI’s IR website at investor.analog.com.
©2012 Analog Devices, Inc. All rights reserved.
Trademarks and registered trademarks are the
property of their respective owners.
BR10212-0-3/12(C)


