Nationwide® Small Company Growth Fund
Unless otherwise noted, all information is as of June 30, 2014, for Class A shares
1
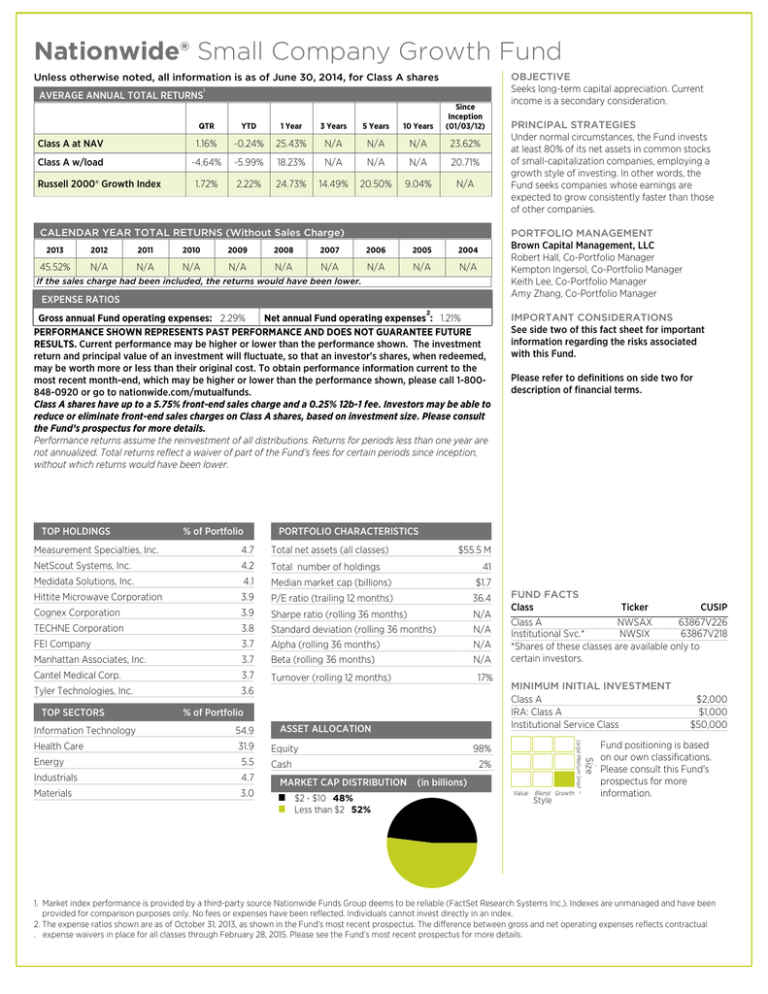
AVERAGE ANNUAL TOTAL RETURNS
QTR
YTD
1 Year
3 Years
5 Years
10 Years
Since
Inception
(01/03/12)
Class A at NAV
1.16%
-0.24%
25.43%
N/A
N/A
N/A
23.62%
Class A w/load
-4.64%
-5.99%
18.23%
N/A
N/A
N/A
20.71%
1.72%
2.22%
24.73%
14.49%
20.50%
9.04%
N/A
Russell 2000® Growth Index
CALENDAR YEAR TOTAL RETURNS (Without Sales Charge)
2013
2012
2011
2010
2009
2008
2007
2006
2005
2004
45.52%
N/A
N/A
N/A
N/A
N/A
N/A
N/A
N/A
N/A
EXPENSE RATIOS
2
Gross annual Fund operating expenses: 2.29%
Net annual Fund operating expenses : 1.21%
PERFORMANCE SHOWN REPRESENTS PAST PERFORMANCE AND DOES NOT GUARANTEE FUTURE
RESULTS. Current performance may be higher or lower than the performance shown. The investment
return and principal value of an investment will fluctuate, so that an investor's shares, when redeemed,
may be worth more or less than their original cost. To obtain performance information current to the
most recent month-end, which may be higher or lower than the performance shown, please call 1-800848-0920 or go to nationwide.com/mutualfunds.
Class A shares have up to a 5.75% front-end sales charge and a 0.25% 12b-1 fee. Investors may be able to
reduce or eliminate front-end sales charges on Class A shares, based on investment size. Please consult
the Fund’s prospectus for more details.
Performance returns assume the reinvestment of all distributions. Returns for periods less than one year are
not annualized. Total returns reflect a waiver of part of the Fund’s fees for certain periods since inception,
without which returns would have been lower.
% of Portfolio
4.7
Total net assets (all classes)
NetScout Systems, Inc.
4.2
Total number of holdings
Medidata Solutions, Inc.
4.1
Median market cap (billions)
$1.7
Hittite Microwave Corporation
3.9
P/E ratio (trailing 12 months)
36.4
Cognex Corporation
3.9
TECHNE Corporation
3.8
FEI Company
3.7
Manhattan Associates, Inc.
N/A
N/A
N/A
N/A
41
3.7
Cantel Medical Corp.
3.7
Turnover (rolling 12 months)
Tyler Technologies, Inc.
3.6
17%
% of Portfolio
Health Care
31.9
5.5
Industrials
4.7
Materials
3.0
Equity
Cash
MARKET CAP DISTRIBUTION
$2 - $10 48%
Less than $2 52%
Ticker
CUSIP
Class A
NWSAX
63867V226
Institutional Svc.*
NWSIX
63867V218
*Shares of these classes are available only to
certain investors.
MINIMUM INITIAL INVESTMENT
Class A
IRA: Class A
Institutional Service Class
98%
--
2%
--
(in billions)
Value
Blend Growth
Style
Size
Energy
ASSET ALLOCATION
FUND FACTS
Class
Large Medium Small ''
54.9
Please refer to definitions on side two for
description of financial terms.
$55.5 M
Sharpe ratio (rolling 36 months)
Standard deviation (rolling 36 months)
Alpha (rolling 36 months)
Beta (rolling 36 months)
Information Technology
IMPORTANT CONSIDERATIONS
See side two of this fact sheet for important
information regarding the risks associated
with this Fund.
PORTFOLIO CHARACTERISTICS
Measurement Specialties, Inc.
TOP SECTORS
PRINCIPAL STRATEGIES
Under normal circumstances, the Fund invests
at least 80% of its net assets in common stocks
of small-capitalization companies, employing a
growth style of investing. In other words, the
Fund seeks companies whose earnings are
expected to grow consistently faster than those
of other companies.
PORTFOLIO MANAGEMENT
Brown Capital Management, LLC
Robert Hall, Co-Portfolio Manager
Kempton Ingersol, Co-Portfolio Manager
Keith Lee, Co-Portfolio Manager
Amy Zhang, Co-Portfolio Manager
If the sales charge had been included, the returns would have been lower.
TOP HOLDINGS
OBJECTIVE
Seeks long-term capital appreciation. Current
income is a secondary consideration.
$2,000
$1,000
$50,000
Fund positioning is based
on our own classifications.
Please consult this Fund's
prospectus for more
information.
1. Market index performance is provided by a third-party source Nationwide Funds Group deems to be reliable (FactSet Research Systems Inc.). Indexes are unmanaged and have been
provided for comparison purposes only. No fees or expenses have been reflected. Individuals cannot invest directly in an index.
2. The expense ratios shown are as of October 31, 2013, as shown in the Fund's most recent prospectus. The difference between gross and net operating expenses reflects contractual
. expense waivers in place for all classes through February 28, 2015. Please see the Fund’s most recent prospectus for more details.
Nationwide® Small Company Growth Fund
DEFINITIONS
Russell 2000® Growth Index: An unmanaged index that measures the performance of the smallcapitalization growth segment of the U.S. equity universe; includes those Russell 2000® Index companies
with higher price-to-book ratios and higher forecasted growth values.
Average annual total returns are the annual compounded returns that would have produced the
cumulative total return if Fund performance had been constant during the given period.
P/E ratio is the price of a stock divided by trailing 12-month earnings per share.
Sharpe ratio is calculated using standard deviation and excess returns over the 3-month U.S. Treasury bill
to determine reward per unit of risk. The higher the Sharpe ratio, the better the fund's historical riskadjusted performance.
Standard deviation is a statistical measure of risk. It reflects the extent to which an asset's rate of return
may fluctuate from period to period.
Alpha represents the difference between a fund's actual returns and its expected performance, given its
level of risk as measured by beta. A positive alpha is the added value an active manager has contributed
over the benchmark returns.
Beta measures the fund's volatility as compared to that of the fund's benchmark index. Less than 1.0
indicates lower volatility than that of the index; greater than 1.0 indicates higher volatility than that of the
index.
IMPORTANT DISCLOSURES
Investing in mutual funds involves risk, including the possible loss of principal. There is no assurance that
the investment objective of any fund will be achieved. Portfolio composition is subject to change at any
time and without notice. The holdings are provided for informational purposes only and should not be
deemed as a recommendation to buy or sell the securities shown.
Investors should carefully consider a fund's investment objectives, risks, fees, charges and expenses
before investing any money. To obtain this and other information on Nationwide Funds, please call
1-800-848-0920 to request a summary prospectus and/or a prospectus, or download a summary
prospectus and/or a prospectus at nationwide.com/mutualfunds. Please read it carefully before investing
any money.
Nationwide Funds distributed by Nationwide Fund Distributors LLC (NFD), member FINRA,
King of Prussia, Pa. NFD is not an affiliate of any subadviser discussed in this material.
Nationwide, Nationwide Financial, the Nationwide framemark, Nationwide Funds and Nationwide Funds
Group are service marks of Nationwide Mutual Insurance Company.
• Not a deposit • Not FDIC or NCUSIF insured • Not guaranteed by the institution
• Not insured by any federal government agency • May lose value
Nationwide Funds
1000 Continental Drive, Suite 400, King of Prussia, PA 19406
Shareholder services and 24-hour account access: 1-800-848-0920
National Sales Desk: 1-877-877-5083
nationwide.com/mutualfunds
MFM-0797AO.7 7/14 © 2014 Nationwide Funds Group. All rights reserved.
IMPORTANT CONSIDERATIONS
The Fund is subject to stock market risk and risks
associated with investing in stocks of smaller
companies. Funds that concentrate on specific
sectors may be subject to greater volatility than
that of other mutual funds. The investment
strategy of holding stocks for long time periods
with an emphasis on particular industries or
sectors may subject the Fund to above-average
short-term volatility. Growth funds may
underperform other funds that use different
investing styles. These risks, as well as others, may
be present during the time you hold shares of the
Fund and may negatively affect the value of your
investment. Please refer to the summary
prospectus for a more detailed explanation of the
Fund's principal risks.
Russell Investment Group is the source and owner
of the trademarks, service marks and copyrights
related to the Russell Indexes, Russell® is a
trademark of Russell Investment Group.


