Optimizing LED Lighting Systems for Efficiency, Size and Cost
advertisement
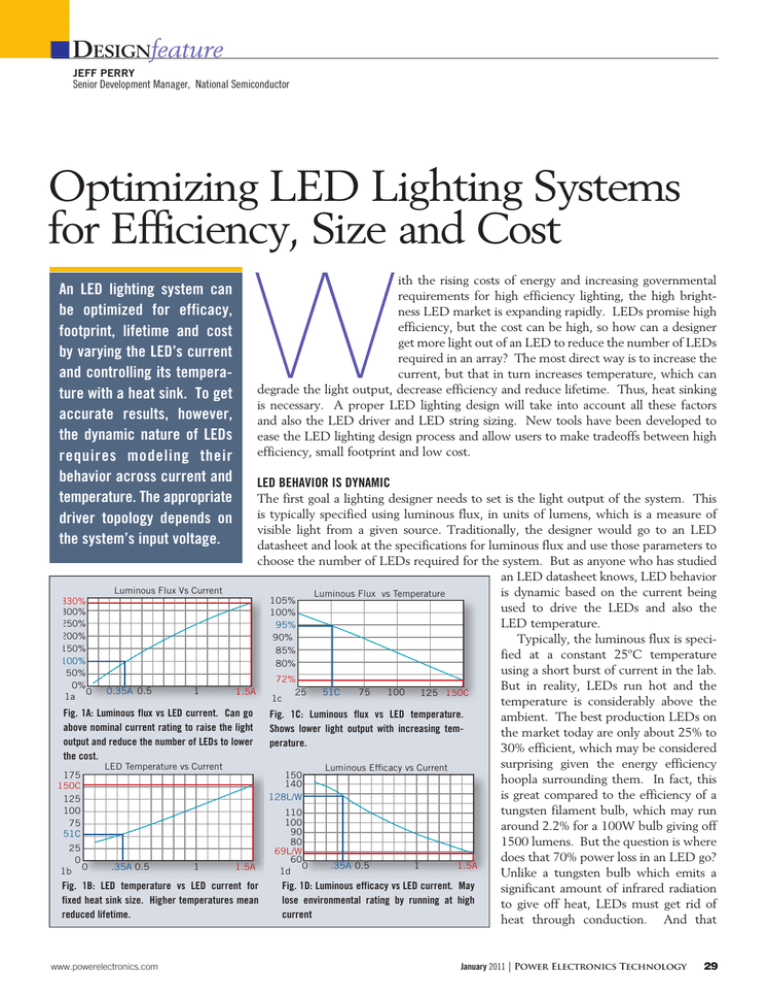
DESIGNfeature JEFF PERRY Senior Development Manager, National Semiconductor Optimizing LED Lighting Systems for Efficiency, Size and Cost An LED lighting system can be optimized for efficacy, footprint, lifetime and cost by varying the LED’s current and controlling its temperature with a heat sink. To get accurate results, however, the dynamic nature of LEDs requires modeling their behavior across current and temperature. The appropriate driver topology depends on the system’s input voltage. W ith the rising costs of energy and increasing governmental requirements for high efficiency lighting, the high brightness LED market is expanding rapidly. LEDs promise high efficiency, but the cost can be high, so how can a designer get more light out of an LED to reduce the number of LEDs required in an array? The most direct way is to increase the current, but that in turn increases temperature, which can degrade the light output, decrease efficiency and reduce lifetime. Thus, heat sinking is necessary. A proper LED lighting design will take into account all these factors and also the LED driver and LED string sizing. New tools have been developed to ease the LED lighting design process and allow users to make tradeoffs between high efficiency, small footprint and low cost. LED BEHAVIOR IS DYNAMIC The first goal a lighting designer needs to set is the light output of the system. This is typically specified using luminous flux, in units of lumens, which is a measure of visible light from a given source. Traditionally, the designer would go to an LED datasheet and look at the specifications for luminous flux and use those parameters to choose the number of LEDs required for the system. But as anyone who has studied an LED datasheet knows, LED behavior Luminous Flux Vs Current is dynamic based on the current being Luminous Flux vs Temperature 105% 330% used to drive the LEDs and also the 300% 100% 250% LED temperature. 95% 200% 90% Typically, the luminous flux is speci150% 85% fied at a constant 25ºC temperature 100% 80% using a short burst of current in the lab. 50% 72% 0% But in reality, LEDs run hot and the 0.35A 0.5 1 0 1.5A 25 51C 75 100 125 150C 1a 1c temperature is considerably above the Fig. 1A: Luminous flux vs LED current. Can go Fig. 1C: Luminous flux vs LED temperature. ambient. The best production LEDs on above nominal current rating to raise the light Shows lower light output with increasing temthe market today are only about 25% to output and reduce the number of LEDs to lower perature. 30% efficient, which may be considered the cost. surprising given the energy efficiency LED Temperature vs Current Luminous Efficacy vs Current 150 175 hoopla surrounding them. In fact, this 140 150C is great compared to the efficiency of a 128L/W 125 100 tungsten filament bulb, which may run 110 100 75 around 2.2% for a 100W bulb giving off 90 51C 80 1500 lumens. But the question is where 25 69L/W does that 70% power loss in an LED go? 60 0 0 .35A 0.5 1 1.5A .35A 0.5 1 1.5A 1b 0 1d Unlike a tungsten bulb which emits a Fig. 1B: LED temperature vs LED current for Fig. 1D: Luminous efficacy vs LED current. May significant amount of infrared radiation fixed heat sink size. Higher temperatures mean lose environmental rating by running at high to give off heat, LEDs must get rid of reduced lifetime. current heat through conduction. And that www.powerelectronics.com January 2011 | Power Electronics Technology 29 LED DRIVERdesign Small footprint 13 0.70 131 35 92 $47.10 Low Cost 8 1.35 140 81 74 $30.07 Balanced 9 1.00 109 119 88 $34.27 Higher Efficacy 12 0.65 78 175 108 $46.08 current and decreases with temperature which may affect the driver design. For example, in a series string of LEDs, the total forward voltage must be kept below the minimum input voltage for a simple buck design, otherwise a boost or buck-boost topology may be required. Thus, we see that the lighting designer must make compromises between cost, footprint, reliability and efficiency when designing an LED system. It’s not as simple as just raising the current. Highest Efficacy 19 0.35 48 837 128 $88.75 LED DESIGN TRADEOFFS # Current Temperature Area Efficacy Optimization LEDs (A) (cm2) (lumens/W) (c) Cost 160 900 140 800 700 120 0111Perry-Fig. 2a 600 100 500 80 400 60 Area Temperature Efficacy, Cost Fig. 2A: Variety of optimizations for 2500 lumen design 300 40 200 20 100 Highest Efficacy Higher Efficacy Balanced Low Cost Small footprint 0 0 Fig. 2B: Tradeoffs for different optimizations of 2500 lumen design means heat sinks and temperature control are a must. What specific parameters should a designer be concerned with which vary with the LED current and temperature? The important ones include luminous flux, Vf (LED forward voltage drop) and luminous efficacy (luminous flux divided by the power consumed in units of lumens/watt) which is a measure of the efficiency of the LED. The luminous flux of LEDs goes up with LED current, which can be useful if a designer wants to reduce the number of LEDs in the array to lower the cost (Fig. 1A). In fact, LEDs can often be driven with up to 2x or 3x the nominal current (check the datasheet for maximum current) to get more light output. But the tradeoff is high temperature which increases with increasing current for a fixed heat sink size (Fig. 1B). Higher temperatures mean decreased lifetime and reliability for the LEDs. This also lowers the light output of the LED, perhaps significantly (Fig. 1C). To lower the temperature, a larger heat sink can be used, but this will increase the cost and footprint of the design. In contrast to the luminous flux, the luminous efficacy goes down with increasing current (Fig. 1D). This drop in efficacy may cause the loss of a governmental efficiency standard approval and certainly make the product less appealing from an energy conservation standpoint. In addition, the forward voltage of the LEDs increases with 30 Power Electronics Technology | January 2011 Let’s take a look at several scenarios using a high efficacy LED for a design targeting 2500 lumens. This can be done using conventional manual methods, or by using a design tool like National Semiconductor’s WEBENCH LED Architect. This new tool draws from an extensive library of LEDs, drivers and heat sinks to design complete systems. WEBENCH LED Architect enables designers to perform real-time comparisons and optimize complex lighting systems for performance, size and cost in minutes using graphical visualizations of the critical parameters. To start a design, the user enters the desired light output in lumens and is presented with a listing of suitable LED and heat sink solutions in both table and chart form. The user can tune the design with the unique WEBENCH Optimizer Dial, prioritizing size, efficacy and cost trade-offs. After selecting the LED and heat sink, different driver options are shown allowing the user to choose between driver topologies and LED string configurations. Graphical charts are utilized to visualize the compromises between footprint, efficiency and price. After choosing the driver, all the components for the system are calculated along with the schematic and operating values such as duty cycle, currents and power dissipation. Electrical simulation is available for analyzing transient behavior. The designer can fine tune the bill of materials (BOM) by choosing different components from a library of over 20,000 passive components or by entering custom component values if desired. Lastly, the designer can order components for prototyping, share the complete system with others, or easily print a complete project report including schematics, BOM and performance characteristics. Using the tool, the variables will be the heat sink thermal resistance (θSA in ºC/W), the LED current, the LED operating temperature and the number of LEDs. The heat sink areas are calculated based on typical extruded aluminum profiles but other solutions, including high thermal conductivity board material, may be used. The scenarios are shown in table form in Fig. 2A and in graphical form in Fig. 2B. The first example is the smallest footprint case. With a small heat sink area we are limited in cooling capability, thus the LED current will need to be kept moderate and the operating temperature will need to be high. We end up with an array of 13 LEDs requiring a heat sink θSA of about 4ºC/W, giving an area of 35cm2. The LED temperature is www.powerelectronics.com LED DRIVERdesign Footprint of HS+ driver (cm2) on the high side at 131ºC and the price 144 for the LEDs and heat sink is $47.10. The 142 LED efficacy is medium at 92 lumens/W. Buck-Boost: With the relatively high temperature, the 140 2x5 LED lifetime will be reduced. 138 The second case is the lowest cost 136 Buck: 3 x 3 scenario. To do this, we will raise the 134 LED current to the maximum to reduce Boost: 132 1x9 the number of LEDs required and use a low cost heat sink, with the tradeoff 130 that the operating temperature will go 128 to a maximum. In this case, eight LEDs are required, requiring a heat sink θSA 73 74 75 76 77 78 79 80 81 82 System efficacy (lumens/watt) of 2.4ºC/watt and area of 81cm2. The operating LED temperature is very high at 140ºC. Efficacy is the lowest at 74 Fig. 3: LED string array and driver options for 15V to 25V input voltage range for a 2500 lumen system. lumens/W due to the combination of Circle size is the cost. high LED current and high temperature. monitor the marketplace on a regular basis to keep up with However, the cost for the LEDs and heat sink is the lowest the latest releases. of all the scenarios at $30.07. The sacrifice here with the high temperature is reduced LED lifetime. The third scenario is a balance between small size, low DRIVING THE LED cost and high efficacy. Here the current is relatively high, In the LED system, after the number of LEDs, the heat sink but the heat sink is allowed to increase in size to an area of and the LED current are determined, a suitable driver must 119cm2 with a θSA of 2.1ºC/W. This lowers the temperabe found to power the LEDs. To achieve the high efficiencies that go along with LEDs, this typically means a switching ture to 109ºC, thus giving an efficacy of 88 lumens/W with regulator is required. Two interacting issues arise: The topolsomewhat increased lifetime, but the temperature is still on ogy of the driver must be decided upon and the LED array the high side. The cost is moderate at $34.27. must be determined. We go to the fourth example to get higher efficacy and lower temperature. This utilizes moderate LED current, At this point, the relationship of the LED array voltage to but the heat sink is larger with an area of 175cm2 and a the input voltage range becomes a critical parameter. If the θSA of 1.8ºC/W. The temperature is reduced to 78ºC, thus total voltage of the LED array is less than the minimum Vin (plus a bit extra to account for losses across the switch), then increasing LED lifetime and yielding an efficacy of 108 a buck topology can be used. This is the simplest topology lumens/W. The $46.08 cost is on the high side. to implement and it carries the advantages of high efficiency The last scenario targets the highest efficacy. It does this and low input current requirement. by lowering the LED current to the nominal datasheet value If the total LED voltage is above the maximum input and using a large heat sink. This keeps the temperature at a voltage, then a boost topology is called for. This is also a minimum of 48ºC, which will result in the longest lifetime proven topology but has the disadvantage of requiring a of the group. The results also show the highest efficacy of all the scenarios at128 lumens/W but the required heat sink θSA is very low at 0.7ºC/W giving a very large area of 837cm2. Driver Vin Vin Driver Driver Driver With the low LED current, there are 19 LEDs required, so Area IC min max Topology Efficiency Cost 2 (cm ) the cost is also very high at $88.75. Thus, we see that the LED performance can vary over a 3.5 35 40 Buck 93% LM3414 $1.90 very large range depending on the current and temperature of the LED. Also, there is no single best solution to the 6.3 20 25 Boost 93% LM3429 $3.02 problem. High efficacy and long lifetime are achieved only by sacrificing cost and area. On the other hand, going for low cost and small footprint requires a compromise between 8.0 25 35 Buck Boost LM3429 $4.04 88% efficacy and lifetime, which are the two main selling points for LEDs. The good news is that LED performance is improving at a breakneck pace with better efficacy bins and Fig. 4: Driver options for different input voltages with total LED string voltage new LED models appearing often. So it is important to of 28.6V. www.powerelectronics.com January 2011 | Power Electronics Technology 31 LED DRIVERdesign ILED sim:1 32 Power Electronics Technology | January 2011 Vin sim:1 high-voltage, high-current FET dependTaking the balanced optimization Area Cost Footprint (cm2) ing on how much the voltage must be from the previous 2500 lumen example increased. This may result in higher cost which in a series configuration has nine LEDs + 119 $34.27 and larger footprint. LEDs for a total string voltage of 28.6V, Heat Sink Lastly, if the LED array voltage is we now examine several driver scebetween the maximum and minimum narios using an input voltage range of 3.5 $1.90 Driver input voltage, then a buck-boost topol15V-25V. Fig. 3 is a chart of the total ogy is required. This allows the most system footprint vs the system luminous flexibility with the LED array voltage, efficacy including the driver losses. The but the driver design is the most com- Fig. 5: LED design is dominated by the LEDs. circle size is proportional to the cost. plicated and expensive to implement. The lower right of the plot shows the Also, like boost, it has the disadvantage of requiring high highest efficacy, lowest footprint solutions. These use a current if the input voltage goes below the LED voltage. single series string of nine LEDs. The total LED voltage of 28.6V is above the 25V maximum Vin, so this requires a boost driver topology. LED ARRAY CONFIGURATION The LED array configuration can be arranged to allow for a The middle of the plot shows buck driver solutions which desired driver topology. If a buck topology is desired, the have the LEDs broken into three separate strings of 9.5V LED array can be broken down into parallel strings such that each, so they are below the minimum input voltage of 15V. the LED string voltages are less than the minimum input The chart shows three separate drivers being used, but they voltage. However, if parallel strings are combined on the could also be combined to use one driver with one current same single output driver with one current sense resistor, it sense resistor to reduce the cost, but at the risk of uneven has the disadvantage that the current in each string may be current sharing. The last group in the upper left uses two different due to the variations in LED forward voltage. This strings of 5 LEDs, each of which results in an LED string may lead to differences in brightness and temperature and voltage of 15.9V. eventually variations in LED lifetime between the strings. Another scenario, shown in Fig. 4, is to vary the input This can be solved by using a driver with multiple outputs voltages in order to get different driver topologies using one and current sense resistors, or by using multiple single outseries string of LEDs. This table zeros in on the driver perput drivers. formance only and does not include the LED and heat sink contributions. In the first case, we target a buck topology so To avoid the current sharing problem, the LEDs can be we use an input voltage range of 35V to 40V, which is above arranged in series. However, the total LED voltage may be the 28.6V LED string voltage. The driver performance, quite high. If the LED voltage exceeds 60V, additional safety excluding the LEDs, produces an efficiency of 93% with a features and certifications may be required to meet governcomponent area of 3.5 cm2 and a cost of $1.90. mental standards. To get a boost topology, we lower the input voltage range 26 1.05 to 20V to 25V so it is below the LED voltage. The efficiency in this case is the same at 93%, but the footprint is larger 24 1 at 6.3 cm2 and the cost about a dollar higher at $3.02. In the last case, we use an input voltage of 25V to 35V 22 0.95 which results in a buck-boost topology since the LED voltage is between the maximum and minimum input voltage. 20 0.9 This gives a lower efficiency of 88%, a higher component footprint of 8 cm2 and a cost of $4.04. 18 0.85 Thus, we can see that the LED driver comprises just 5% to 15% of the total system cost and the LED driver efficiency 16 0.8 is high at 93% vs 24% for the total system (see Fig. 5 ). The last step in the driver design process is creating the 14 0.75 actual design. Driver design tools automatically generate a bill of materials and allow the user to change passive compo12 0.7 0 50 100 150 200 250 300 350 400 450 nents and run simulations to verify system performance. Fig. t e-6 secs iled vin 6 displays the results of an input transient simulation run in the WEBENCH LED (http://www.national.com/analog/ Fig. 6. Results of an input transient simulation run in National Semiconductor’s led#software) Architect design tool, showing the effects of WEBENCH LED Architect driver design tool showing the effects of changing the changing the input voltage on the LED current. input voltage on the LED current. www.powerelectronics.com
