Kampala
advertisement
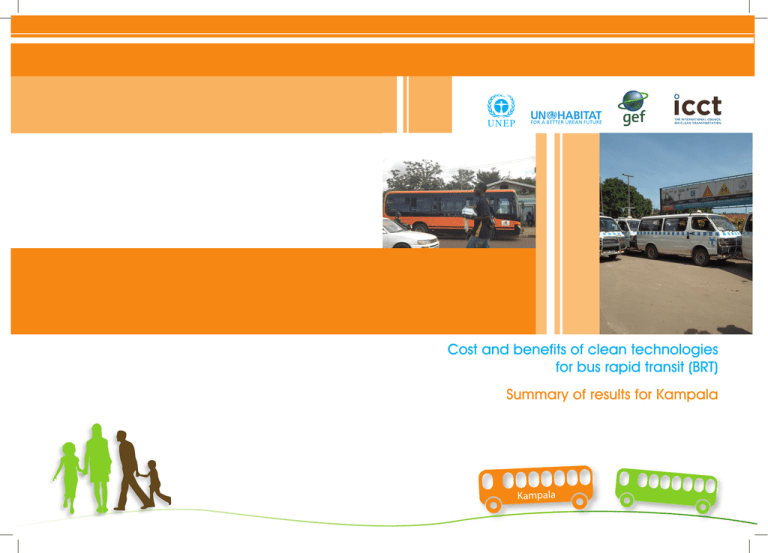
U NE P United Nations Environment Programme Cost and benefits of clean technologies for bus rapid transit (BRT) Summary of results for Kampala Kampala Author: International Council on Clean Transportation (ICCT) Disclaimers The content and views expressed in this publication do not necessarily reflect the views or policies of the United Nations Environment Programme (UNEP). Neither do they imply any endorsement. The designations employed and the presentation of material in this publication do not imply the expression of any opinion whatsoever on the part of UNEP concerning the legal status of any country, territory, or city or its authorities, or concerning the delimitation of its frontiers and boundaries. Mention of a commercial company or product in this publication does not imply the endorsement of UNEP. Reproduction This publication may be reproduced in whole or in part and in any form for educational or non-profit purposes without special permission from the copyright holder, provided acknowledgement of the source is made. UNEP would appreciate receiving a copy of any publication that uses this publication as a source. No use of this publication may be made for resale or any other commercial purpose whatsoever without prior permission in writing from UNEP. Applications for such permission, with a statement of purpose of the reproduction, should be addressed to the Division of Technology, Industry and Economics, Transport Unit, UNEP, P.O. Box 30552, Nairobi 00100, Kenya, pcfv@unep.org. The use of information from this publication concerning proprietary products for publicity or advertising is not permitted. Photo credit © UN-Habitat Design and Printing: UNON Publishing Services Section, UNON, Nairobi, ISO 10041:2004 certification UNEP promotes environmentally sound practices globally and in its own activities. This report is printed on paper from sustainable forests including recycled fibre. The paper is chlorine free and the inks vegetable-based. Our distribution policy aims to reduce UNEP’s carbon footprint. Cost and benefits of clean technologies for bus rapid transit (BRT) Summary of results for Kampala December, 2012 Kampala 2 CLEAN TECHNOLOGY OPTIONS FOR GEF SUSTRAN PROJECTS IN EAST AFRICA 3 Introduction In Eastern Africa, as in the rest of the continent, cities are expanding at unprecedented rates and are facing sustained population growth, rapid motorization rates, rapidly worsening traffic congestion, and thus decreasing mobility and increasing health problems. The Governments of Kenya, Uganda and Ethiopia have recognized the importance of efficient, low-cost public transport and non-motorized transport as a means of helping in poverty alleviation, spurring economic growth in the urban centres, and providing alternative and affordable transport. The GEF funded project “Promoting Sustainable Transport Solutions for East Africa” (GEF SUSTRAN) aims to provide technical and institutional support to the three capital cities of Kenya, Uganda and Ethiopia on the design and implementation of high quality, efficient public transport that integrates nonmotorised transport. The aim is to reduce growth in private motorized vehicles, thus reducing traffic congestion and greenhouse gas (GHG) emissions through upgrade to their transit systems; implement improved non‐motorized transport infrastructure; apply travel demand management; as well as other supporting policies. Bus Rapid Transit (BRT) systems have been shown to be one of the biggest reducers of greenhouse gases emissions in cities of developing countries. The sustainability of BRT systems will however depend critically on the energy source, fuel type and quality, vehicle technology and the infrastructure available. A cost benefit analysis (CBA) of different clean technology options for BRT buses, taking in account the local situation in each of the three SUSTRAN cities, was carried out. These included the existing and future energy sources (including regional sources); fuel type and quality; vehicle technology and infrastructure, available in each of the three cities of Nairobi, Kampala and Addis Ababa.The CBA also compares costs – in economic, environmental and social terms – with benefits. Following the CBA, tailor-made advice will be provided for each of the three capital cities of Kenya, Uganda and Ethiopia on the most appropriate and best available clean technology for BRT buses, and an analysis of applying specific clean technology measures in each of the three cities. Kampala 4 CLEAN TECHNOLOGY OPTIONS FOR GEF SUSTRAN PROJECTS IN EAST AFRICA The GEF SUSTRAN project is coordinated by the United Nations Human Settlements Programme (UN-HABITAT), whilst the United Nations Environment Programme (UNEP), Transport Unit is taking the lead in the clean technology component of the project. The aim of the clean technology component is to provide technical assistance to the governments of Kenya, Uganda and Ethiopia in selecting the most appropriate available clean technology for BRT buses, subject to local conditions.UNEP contracted the International Council on Clean Transportation (ICCT) to carry out the CBA. This report summarizes the findings of the cost and benefit analysis carried outby the ICCT in the three cities on Nairobi, Kampala and Addis Ababa Key findings • • • • Based on preliminary assumptions about the future BRT system, the ICCT’s modeling of city-wide pollutant emissions, fuel consumption, health impacts, and time saved suggest that a BRT system in Kampala will result in considerable overall benefits in the range of $80 to $86 million per year in 2035. Costs for vehicles and infrastructure range $21 to 26 million per year1. Bus technology feasibility analysis identified multiple potential technologies for consideration in Kampala’s BRT system: diesel, and hybrid diesel-electric for Phase I (2013-2020); and clean diesel (with exhaust after-treatment devices), hybrid diesel-electric, and electric trolley buses for Phase II (20202030). Among the BRT bus technologies, the analysis revealed that the selection of any of the advanced technology choices – including the cleanest diesel conventional and hybrid-electric buses and trolley electric buses – will result in significant emissions reductions at modest additional cost over a Euro III diesel baseline bus. Several of these advanced technology choices result in significant fuel use and CO2 emissions reductions (in the range of 750 to 850,000 cumulative tons by 2035). The specific choice of advanced technology should be based on more refined inputs for the planned future BRT system (i.e targeted capacity) in Kampala as well as future fuel availability (i.e. excess electricity for transportation). 1 Costs assessed in this study do not include the costs for building the BRT infrastructure 5 Project scope The project scope was developed in collaboration with the GEF Sustran project partners interviewed during the project initial site visits. The analysis considers two phases: 2013-2020 and 2020-2030. Benefits and costs are assessed in 2035 when the BRT project is fully implemented. In addition to comparing the relative costs and benefits of clean bus technologies, project partners requested that results reflect the benefits of a BRT system compared to the current baseline (“no BRT”). The emission and health benefits are modeled over the entire metropolitan area in line with the resolution of needed data inputs such as background air pollutant concentrations. Project approach overview The ICCT’s approach to selecting and evaluating the different vehicle technology and fuel options for each city is summarized as follows. 1. Determine feasible BRT bus technologies and fuels: A comprehensive set of selection criteria is applied to the full range of existing bus technologies. The highest ranked options are selected for further evaluation. 2. Model the cost of ownership for each feasible technology/fuel combination: Using the BestBus model2, estimate the capital and operational costs at the bus depot level for each option. Output in $/km varies by fleet size. 3. Model the emissions under the baseline (“no BRT”) and clean technology scenarios: Using the ICCT Country Emission Model template adapted to city level analysis, estimate the emissions and fuel use over the analysis period from buses and the rest of the vehicle fleet. Key inputs include assumptions about the size and operation of the BRT system such as the target modal shift. 4. Convert emissions reductions into health benefits expressed monetarily: Using the ICCT City Health Model Template, estimate the reductions in premature mortality from pollution exposure abatement and its monetary valuation using standardized methodologies. 5. Estimate the monetary value of fuel savings: Using the output of the emission model and assumption on fuel costs from project partners, estimate for each scenario savings from reduction in fleet-wide fuel use. 6. Estimate the monetary value of time savings: Using assumptions about the relative traffic speeds between BRT and no-BRT scenarios, estimate time saved from reduced congestion and apply valuation of time saved based on standardized methodologies. 2 Duke University, Life Cycle Cost & Emissions Model Alternative Bus Technologies, Developed by M.J. Bradley & Associates, 2006. Kampala 6 CLEAN TECHNOLOGY OPTIONS FOR GEF SUSTRAN PROJECTS IN EAST AFRICA Data inputs As the literature provided few comprehensive sources of current, localized data required for the analysis, the project team relied on input from project partners and local experts, data from similar projects in other parts of the world (especially Asia and Latin America) and assumptions deemed reasonable by project partners. It is critical to note that the final benefits and costs analysis is very sensitive to certain input parameters and assumptions (for example, projected size and operation of the BRT system). Accordingly, future efforts to collect better data on the current and future transport system in the city will be instrumental to accurately evaluating the impacts. Key inputs and assumptions are listed in detail in the sections below. Technology options for Kampala Virtually all bus technologies used internationally were initially considered for potential application in Kampala. These include conventional diesel buses, biodiesel buses, hybrid-electric buses, buses fueled with gas (including LPG, CNG, and LNG), and buses fueled with electricity (including trolley, fuel cell, capacitor, and battery electric). Based on initial input from project partners on fuel availability as well as consideration of technology maturity, it was determined that only conventional diesel, hybrid electric, and trolley buses were feasible for Kampala. Subsequently, a feasibility model was developed to determine scores for each technology according to certified tailpipe emission standard and other factors. The technology scoring highlighted the following top technologies for consideration in Kampala’s BRT system: Table 1. Ranking of top technologies for Addis Ababa Rank Phase I (2013-2020) Phase II(2020-2030) 1 Hybrid diesel Euro IV Electric trolley bus 2 Diesel Euro IV Hybrid diesel Euro VI 3 Clean diesel Euro VI Based on the rankings in Kampala and the two other cities, a set of 5 technology scenarios were developed combining Phase I and Phase II technologies. Scenarios 1,2,3, and 5 were all analyzed for Kampala. 7 Table 2. Technology scenarios for Phase I and II No BRT: Baseline BRT 1: Diesel BRT BRT 2: Clean diesel BRT BRT 3: Hybrid diesel BRT BRT 4: LPG BRT BRT 5a: Electric trolley BRT BRT 5b: Diesel + Electric trolley BRT No BRT Euro III Euro IV Hybrid Euro IV Not assessed Electric Trolley Diesel Euro IV No BRT Euro III Euro VI Hybrid Euro VI Not assessed Electric Trolley Electric Trolley Cost of ownership for Kampala Cost model inputs The BestBus cost model requires inputs for capital costs (buses, fueling station/ electric infrastructure and depot upgrades) and operating costs (fuel, bus and infrastructure maintenance) for each of the technologies/fuel anticipated by city. The inputs were derived from data obtained during the initial site visit supplemented by desk research. Table 3. Summary of cost model inputs Depot and Local Data Assumptions Source/Comments Conversion rates, $1 USD 2500 UGX (1) Number of Buses 10-400 (2) BRT System Length, km 29 (2) Annual Travel, km 50,000 (2) See emissions model Labor Rates 5000 UGX/hr (3) Inflation 8.5% (1) Capital discount rates 6% (2) Diesel price per liter 3150UGX/L = $USD 4.8 /gal (1) LPG price per liter $USD 4.4/gal (4) Electricity price per kWh 487 UGX/kWh~0.20 $USD/kWh (5) 1. World Data Bank (2012). World Development Indicators (WDI) and Global Development Finance. http://data.worldbank.org/data-catalog 2. ICCT assumption, buses fleet and system size depends on year of program 3. Average value from newspaper job postings for drivers in Nairobi, Kenya, Kampala CLEAN TECHNOLOGY OPTIONS FOR GEF SUSTRAN PROJECTS IN EAST AFRICA and the report by the World Bank and the Economic Commission for Africa, Scoping Study, Urban Mobility in Three cities Addis Ababa, Dar es Salaam and Nairobi. Working Paper No 70. 4. ICCT data 5. Local commercial tariff Cost results The total cost of ownership was evaluated for the vehicle lifetime. Internal combustion engine (ICE) buses were assumed to have a 15-year useful life; trolley buses were assumed to have 20-year useful life. Capital costs were distributed along the vehicle useful life; bus overhaul costs were assumed following expected overhaul periods, which vary for each bus technology. Operating costs were linked to vehicle kilometers traveled and/or time. Cost of ownership results, in $USD per km, assuming 100 buses and 29-km of BRT corridor are presented below. Increasing the number of buses only marginally reduces the cost per mile of ICE (diesels and hybrid), but has a very significant effect on trolleys, as the infrastructure cost are spread among the fleet. LPG was included in cost calculations. Among all three cities, the lowest cost per km is observed in Addis Ababa given the relatively low cost of diesel. Figure 1 3.5 3 2.5 Cost per km, $USD 8 Kampala cost of ownership in $USD per km. Assumes 100 buses and 29 km of BRT corridor Fuel Station/Elec. Grid Maintenance Bus Overhaul Costs Bus Maintenance Capital Special Maintenance Tools Fuel Capital Fuel Station/Elec. Grid Operator Wages Capital Bus Purchase $2.54 2 1.5 $1.92 $1.97 $1.98 1 0.5 0 Baseline Diesel Clean Diesel Hybrid Electric Trolley 9 Total annual cost, including capital and operating costs, are calculated by multiplying expected annual VKT (~50,000 km/year) by the number of BRT buses and the cost per kilometer. Differences with respect to the standard diesel option, Diesel Euro III, are presented below. The benefits from trolley implementation during Phase II arise from energy cost reductions due to electricity use, which is very competitive compared to diesel prices in Kampala. In addition, increased number of trolley buses reduces the impact of high capital costs for trolley implementation. Figure 2. Incremental annual cost compared to diesel BRT (Euro III) KAMPALA - ANNUAL COST - Advanced BRT Technologies vs BRT Diesel Euro 3 $6 $USD Millions BRT 2 (Clean diesel) $5 BRT 3 (Hybrid diesel) $4 BRT 5 (diesel+trolley) $3 $2 $1 $0 2010 2015 2020 2025 2030 2035 City-wide emissions reductions for Kampala Emissions and fuel use from on-road transport modes under the baseline (“no BRT”) and the various identified BRT technology scenarios were modeled using the modified ICCT Country Emission Model. As mentioned previously, little input data were available for several key parameters, most importantly future BRT system size and operation. Therefore, the results presented here should be considered preliminary results highlighting the important distinctions between the different bus technology options, though the specific magnitude of some results may change as more input data are identified. Kampala 10 CLEAN TECHNOLOGY OPTIONS FOR GEF SUSTRAN PROJECTS IN EAST AFRICA Emission model inputs Key data inputs and sources for Kampala are summarized in the following table. Table 4. Summary of inputs to emission model Parameter Value(s) Source Passenger cars (2010 stock) 42,000 (1) Passenger cars (2010 VKT, km) 16,745 (1) Passenger cars (load factor) 1.8 (4) Taxis (2010 stock) 170 (2) Taxis (2010 VKT, km) 50,000 (4) Taxis (load factor) 1.5 (4) Minibuses (2010 stock) 8,000 (1) Minibuses (2010 VKT, km) 40,000 (1) Minibuses (load factor) 7 (4) Light-duty trucks (2010 stock) 2,500 (2) Light-duty trucks (2010 VKT, km) 30,000 (3) Urban buses (non-BRT) (2010 stock) 43 (1) Urban buses (non-BRT) (2010 VKT, km) 100,000 (1) Urban buses (non-BRT) (2010 load factor) 75 (4) Heavy-duty trucks (2010 stock) 800 (2) Heavy-duty trucks (2010 VKT, km) 60,000 (3) Motorcycles (2010 stock) 700 (2) Motorcycles (2010 VKT, km) 7,000 (3) Motorcycles (load factor) 1 (4) Number of BRT buses, 2030 228 (5) VKT of BRT buses, km 50,000 (4) Load factor of BRT buses 75 (4) Modes from which BRT buses pull Minibuses (100%) (4) BRT system assumptions 11 1. UITP, UATP, TransAfrica, 2010. Report on Statistical Indicators of Public Transport Performance in Africa. 2. Estimated based on data from Nairobi on fractions of vehicle operating on the road, as documented in ISSRC, 2002. Nairobi, Kenya Vehicle Activity Study. 3. Estimated based on comparable numbers for China, from Huo, H., et al., 2012. Vehicle-use intensity in China: Current status and future trend. Energy Policy, Volume 43, April 2012, Pages 6–16. 4. ICCT assumption. 5. ICCT estimate based on combination of total urban passenger-km demand in 2030 and modal shift assumption. Table 5: Typical fuel economy values for bus technologies considered Bus type Baseline Diesel, km/L Clean Diesel, km/L Hybrid Diesel, km/L LPG, km/LDE Electric Bus – Trolley, km/kW-h Electric Bus – Trolley, km/LDE 12 m Bus 1.6 1.6 2.0 1.4 0.27 2.7 Articulated Bus 1.1 1.1 1.4 1.0 0.19 1.9 LDE: Liter of diesel equivalent. No BRT vs. BRT modal share The BRT system in Kampala, when fully implemented in 2030, was assumed to pull completely from minibuses passenger-km. This change is highlighted in the graphs below. The modal share shift assumptions made by the ICCT are important parameters that will need to be updated as more data about the future planned BRT system become available. In the Kampala case, the large estimated size of the BRT system as compared to the baseline vehicle population results in larger modal shift from to the BRT system than the other two cities evaluated. Kampala CLEAN TECHNOLOGY OPTIONS FOR GEF SUSTRAN PROJECTS IN EAST AFRICA Figure 3. Modal share under no-BRT and BRT scenarios Percentage of passenger-km by mode, no BRT case 100% Motorcycles 80% Urban Buses (non-BRT) 60% Minibus 40% Taxis 20% 0% 2000 2002 2004 2006 2008 2010 2012 2014 2016 2018 2020 2022 2024 2026 2028 2030 2032 2034 Passenger Cars Percentage of passenger-km by mode, BRT case 100% B RT Buses 80% Motorcycles 60% Urban Buses (non-BRT) 40% Minibus Taxis 20% Passenger Cars 2034 2032 2030 2028 2026 2024 2022 2020 2018 2016 2014 2012 2010 2008 2006 2004 2002 0% 2000 12 Under the current modal shift assumption, the BRT system will result in considerably reduced minibus demand. The analysis suggests that over 6,500 minibuses will be no longer necessary in Kampala due to the BRT system. Fuel consumption and emissions differences The shifting of passenger-km from minibuses to BRT buses results in considerable fuel savings and emissions reductions. The graphs below present the reductions in fuel consumption and emissions of particulate matter (PM2.5) and oxides of nitrogen (NOx) between the no BRT and BRT scenarios. 13 Figure 4. Reduction in fuel use and pollutant emissions compared to no-BRT scenario (emissions compare no- BRT to BRT1) Difference in fuel consumption between no BRT and BRT cases 0 2010 million liters -5 2015 2020 2025 2030 2035 -10 B RT 1 (diesel) B RT 2 (diesel) -15 B RT 3 (diesel) -20 B RT 5 (diesel) -25 -30 Reduction in annual emissions of BRT vs no BRT case 2010 0 2015 2020 2025 2030 2035 -20 -40 tons -60 PM2.5 -80 NOx -100 -120 -140 -160 -180 The following figures feature the differences between the all the BRT scenarios and the no-BRT scenarios. Kampala CLEAN TECHNOLOGY OPTIONS FOR GEF SUSTRAN PROJECTS IN EAST AFRICA Figure 5. Fuel savings and CO2 reduction by technology compared to no BRT Fuel savings of BRT scenario vs. no BRT scenario millions of liters 0 BRT 1 (diesel) BRT 2 (diesel) BRT 3 (diesel) BRT 4 (diesel) BRT4 (LPG) BRT 5 (diesel + trolley) -5 -10 -15 -20 -25 -30 Avoided CO2 emissions of BRT scenario vs. no BRT scenario 0 -100,000 -200,000 -300,000 -400,000 -500,000 -600,000 -700,000 -800,000 -900,000 tons 14 BRT1 (Euro III diesel) BRT2 (clean diesel) BRT3 (hybrid diesel) BRT4 (LPG) BRT5 (diesel + trolley) 15 Figure 6. Pollutant emission reduction by technology compared to no BRT PM2.5 reductions of BRT scenario vs. no BRT scenario -26.6 BRT1 (Euro III diesel) BRT2 (clean diesel) BRT3 (hybrid diesel) BRT5 (diesel + trolley) BRT4 (LPG) -26.8 -27 tons -27.2 -27.4 -27.6 -27.8 -28 -28.2 NOx reductions of BRT scenario vs. no BRT scenario 0 BRT1 (Euro III diesel) BRT2 (clean diesel) BRT3 (hybrid diesel) BRT4 (LPG) BRT5 (diesel + trolley) -50 tons -100 -150 -200 -250 -300 Annual PM2.5 emissions reductions from different BRT bus technologies are especially dramatic. Exposure to PM2.5 is associated with a host of health impact including premature death. Note that all of the advanced technologies result in significant emissions savings as compared with the baseline Euro III diesel technology as shown in Figure 7 below. Kampala CLEAN TECHNOLOGY OPTIONS FOR GEF SUSTRAN PROJECTS IN EAST AFRICA Figure 7 Comparative annual emission by technology Annual PM 2.5 Emissions, BRT Buses Only 1.2 1 BRT 1 (Euro III diesel) 0.8 tons 16 BRT 2 (clean diesel) 0.6 BRT 3 (hybrid diesel) 0.4 BRT 4 (LPG) 0.2 BRT 5 (diesel + trolley) 0 2000 2005 2010 2015 2020 2025 2030 2035 Health benefits for Kampala The health benefits from the BRT scenarios stem from reductions in exposure to harmful pollutants. For this study, the focus is on reduction of exposure to PM2.5, which is translated into a reduced incidence of premature mortality. The reduction in mortality is assigned a value given by the Value of Statistical Life (VSL) based on willingness to pay studies. In this case, the ICCT applied the same methodology as was used by ICF in their recent assessment of the cost and benefits of lower sulfur fuels in Sub-Saharan Africa3. Figure 8 and 9 illustrate the health benefits over time. 3 ICF International. 2009. Final Report: Sub-Saharan Africa Fuel Refinery Project. World Bank and Africa Refiners Association. 17 Figure 8. Health benefits of diesel BRT (Euro III) compared to no-BRT Kampala: Annual Health Benefits Diesel Euro III buses vs. no-BRT scenario (Discounted Benefits (2011 international $) 180000 VSL (1) 1.5 160000 VSL (2) 1.5 Lower bounded VSL 140000 120000 100000 80000 60000 40000 20000 0 Figure 9. 2010 2015 2020 2025 2030 2035 Health benefits of clean technologies compared to diesel BRT (Euro III) Kampala: Annual Health Benefits VSL (1), elasticity = 1.5, improved technology vs. Euro III diesel Diesel Euro IV until 2019;Trolley buses beginning 2020 (Scenario 5) (Discounted benefits (2011 International $) Hybrid Diesel Euro IV until 2019; Euro VI beginning 2020 (Scenario 3) Diesel Euro IV until 2019; Euro VI beginning 2020 (Scenario 2) 5000 4500 4000 3500 3000 2500 2000 1500 1000 500 500 2010 2015 2020 2025 2030 Year Kampala 2035 CLEAN TECHNOLOGY OPTIONS FOR GEF SUSTRAN PROJECTS IN EAST AFRICA Time saving benefits for Kampala The benefits of reduced congestion were estimating by assigning the value of the prevailing wage ($0.64/hour) to the estimated travel time saved. Absent data specific to the Kampala BRT system, traffic speeds from the Chinese city of Guangzhou with and without BRT were used to approximate travel time savings in Kampala. The average traffic speed without BRT are based on estimates for Kampala (10 km/hour). It is important to note that the time saving benefits are technology independent so they apply equally to all the BRT scenarios considered. Figure 10. Time saving benefits over time Kampala: Annual travel time saved with BRT Time saved Value of time saved 60,000,000 90000000 Annual time saved (hours) 18 80000000 50,000,000 70000000 40,000,000 60000000 50000000 30,000,000 40000000 30000000 20,000,000 20000000 10,000,000 10000000 0 2010 2015 2020 Years 2025 2030 2035 0 Costs and benefits in 2035 for Kampala The following table summarizes the technology costs and health, fuel, and time savings benefits assessed for the four technology scenarios considered for Kampala. The quantifiable benefits from a BRT system are substantial and in line with the estimate annual costs of purchasing and maintaining a bus fleet. When considering the benefits that are beyond the scope of this project (i.e. occupational exposure, fuel foreign exchange fees, mobility, access), it is clearly a valuable mass transit investment. Incorporating clean technology alternatives 19 provides additional health and fuel savings benefits at a relatively modest incremental cost. Ultimately the choice of technology for the Kampala BRT should be based on more refined and project-specific input data. Ongoing projects to compile and maintain a basic transportation information database (i.e. fleet size, vkt, modal shares) will be valuable resources for similar future efforts. Table 6. Summary of cost and benefits of technology scenarios in 2035 Scenarios Annual technology cost Annual health benefits Annual fuel savings benefit Annual time savings benefit BRT 1: Diesel BRT $21 $0.11 to $2.1 $25 $53 BRT 2: Clean diesel BRT $23 $0.12 to $2.2 $25 $53 BRT 3: Hybrid diesel BRT $23 $0.12 to $2.2 $27 $53 BRT 4: LPG BRT n/a n/a n/a n/a BRT 5: Diesel + Electric trolley BRT $26 $0.12 to $2.2 $32 $53 Kampala 20 CLEAN TECHNOLOGY OPTIONS FOR GEF SUSTRAN PROJECTS IN EAST AFRICA Key Organizations involved in the GEF Sustran project Global Environment Facility (GEF) The GEF unites 182 countries in partnership with international institutions, civil society organizations and the private sector to address global environmental issues while supporting national sustainable development initiatives. Today the GEF is the largest public funder of projects to improve the global environment. An independently operating financial organization, the GEF provides grants for projects related to biodiversity, climate change, international waters, land degradation, the ozone layer, and persistent organic pollutants. United Nations Environment Programme (UNEP) UNEP is the United Nations systems designated entity for addressing environmental issues at the global and regional level. Its mandate is to coordinate the development of environmental policy consensus by keeping the global environment under review and bringing emerging issues to the attention of governments and the international community for action. United Nations Human Settlements Programme (UN-HABITAT) UN-HABITAT, is the United Nations agency for human settlements. It is mandated by the UN General Assembly to promote socially and environmentally sustainable towns and cities with the goal of providing adequate shelter for all.UN-HABITAT’s programmes are designed to help policy-makers and local communities get to grips with the human settlements and urban issues and find workable, lasting solutions. International Council on Clean Transportation (ICCT) The ICCT is an independent non- profit organization founded to provide firstrate objective research and technical and scientific analysis to environmental regulators. Our mission is to improve the environmental performance and energy efficiency of road, marine, and air transportation, in order to benefit public health and mitigate climate change. Author: International Council on Clean Transportation (ICCT) Disclaimers The content and views expressed in this publication do not necessarily reflect the views or policies of the United Nations Environment Programme (UNEP). Neither do they imply any endorsement. The designations employed and the presentation of material in this publication do not imply the expression of any opinion whatsoever on the part of UNEP concerning the legal status of any country, territory, or city or its authorities, or concerning the delimitation of its frontiers and boundaries. Mention of a commercial company or product in this publication does not imply the endorsement of UNEP. Reproduction This publication may be reproduced in whole or in part and in any form for educational or non-profit purposes without special permission from the copyright holder, provided acknowledgement of the source is made. UNEP would appreciate receiving a copy of any publication that uses this publication as a source. No use of this publication may be made for resale or any other commercial purpose whatsoever without prior permission in writing from UNEP. Applications for such permission, with a statement of purpose of the reproduction, should be addressed to the Division of Technology, Industry and Economics, Transport Unit, UNEP, P.O. Box 30552, Nairobi 00100, Kenya, pcfv@unep.org. The use of information from this publication concerning proprietary products for publicity or advertising is not permitted. Photo credit © UN-Habitat Design and Printing: UNON Publishing Services Section, UNON, Nairobi, ISO 10041:2004 certification UNEP promotes environmentally sound practices globally and in its own activities. This report is printed on paper from sustainable forests including recycled fibre. The paper is chlorine free and the inks vegetable-based. Our distribution policy aims to reduce UNEP’s carbon footprint. U NE P United Nations Environment Programme Cost and benefits of clean technologies for bus rapid transit (BRT) Summary of results for Kampala Kampala
