International Journal of Innovative Research in Advanced Engineering (IJIRAE)
Volume 1, Issue 1 (March 2014)
ANALYSIS OF DISTIRIBUTION TRANSFORMER
LOSSES IN FEEDER CIRCUIT
Tamizharasi.P
Anuradha.R
Ayshwarya.A.R
ASSISSTANT PROFESSOR/EEE
Adhiparasakthi Engineering College
Melmaruvathur, Tamil Nadu
UG Scholar/EEE
Adhiparasakthi Engineering College
Melmaruvathur, Tamil Nadu
UG Scholar/EEE
Adhiparasakthi Engineering College
Melmaruvathur, Tamil Nadu
anuradha3933@gmail.com
yashu9aw@gmail.com
ptamizharasi@adhiparasakthi.in
Abstract—efficient use of electrical energy includes all the technical and non-technical measures to reduce
the electrical energy demand of an electrical distribution system. In this paper an assessment and
minimization of distribution transformer losses is carried out in detail with the help of simulation using
ETAP software. Statistical data of one year on 11kv Alaiamman Koil feeder of 33kv substation has been
analyzed and the results were presented. Month wise cumulative percentage of no load and full load losses of
distribution transformer were taken into consideration for analysis. The simulation result obtained shows the
maximum distribution transformer losses in feeder circuit and based on this simulation result, suggestion
were given for further improvement of efficiency of the system and reduction of losses based on simulation
studies carried out.
Index Terms—Feeder circuit, Loss calculation, Loss factor, Transformer losses.
I. INTRODUCTION
Electrical energy is the cleanest form of energy. Electrical energy is converted from various forms of conventional
and non- conventional energy source at suitable location. Transmitted at high voltage over long distance and
distributed to the consumers at a medium or low voltage. The electric power system includes a generation,
transmission and distribution system. Total system loss indicates how effectively and efficiently a power system is
delivering a power to its customers. Hence became one of the controlling factor while planning and operating
strategies. Most of the power utilities have high transmission and distribution losses which occur due to technical
and non- technical losses. As the non – technical transmission losses are negligible, total system losses consist of
technical transmission loss and technical and non -technical distribution losses. A distribution system is that of
power system which distributes power to the consumer for local use. It consists of a large number of distribution
transformer, feeder, and service mains. The distribution system losses have two components namely technical and
non - technical together are called “total distribution loss”.
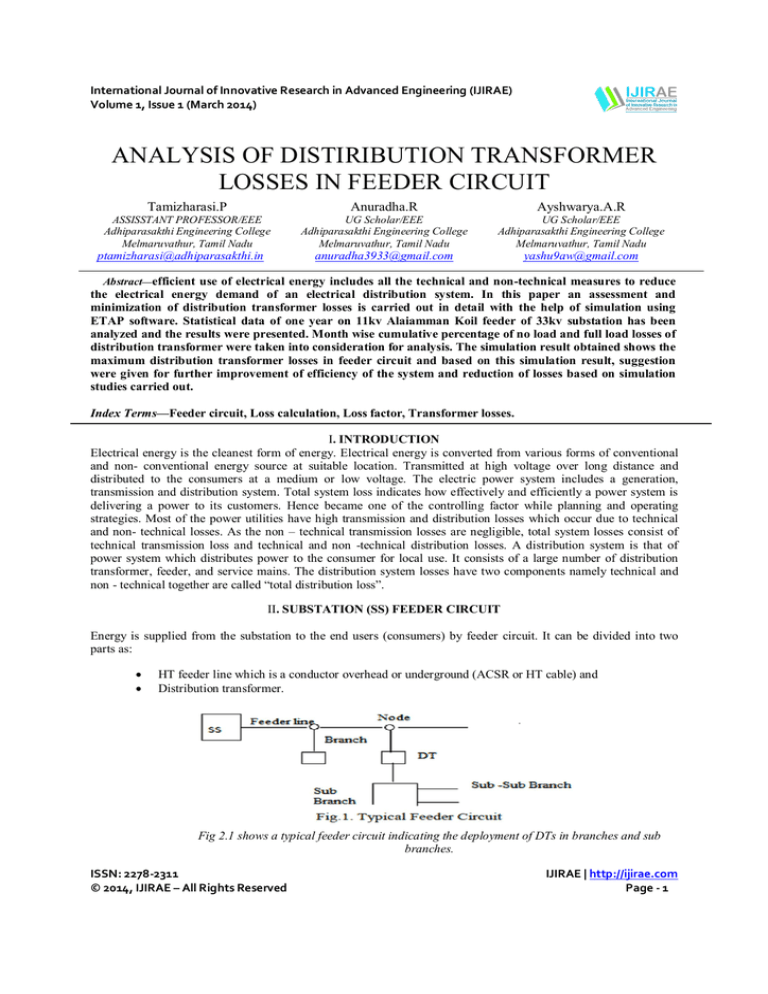
II. SUBSTATION (SS) FEEDER CIRCUIT
Energy is supplied from the substation to the end users (consumers) by feeder circuit. It can be divided into two
parts as:
HT feeder line which is a conductor overhead or underground (ACSR or HT cable) and
Distribution transformer.
Fig 2.1 shows a typical feeder circuit indicating the deployment of DTs in branches and sub
branches.
ISSN: 2278-2311
© 2014, IJIRAE – All Rights Reserved
IJIRAE | http://ijirae.com
Page - 1
International Journal of Innovative Research in Advanced Engineering (IJIRAE)
Volume 1, Issue 1 (March 2014)
III. DISTRIBUTION SUBSTATION
A distribution substation transfers power from the transmission system to the distribution system of an
area. It is uneconomical to directly connect electricity consumers to the main transmission network, unless they use
large amounts of power, so the distribution station reduces voltage to a level suitable for local distribution. The input
for a distribution substation is typically at least two transmission or sub-transmission lines. Input voltage may be, for
example, 115 kV, or whatever is common in the area. The output is a number of feeders. Distribution voltages are
typically medium voltage, between 2.4 kV and 33 kV depending on the size of the area served and the practices of
the local utility. The feeders run along streets overhead (or underground, in some cases) and power the distribution
transformers at or near the customer premises. In addition to transforming voltage, distribution substations also
isolate faults in either the transmission or distribution systems. Distribution substations are typically the points of
voltage regulation, although on long distribution circuits (of several miles/kilometers), voltage regulation equipment
may also be installed along the line. The downtown areas of large cities feature complicated distribution substations,
with high-voltage switching, and switching and backup systems on the low-voltage side.
IV. DISTRIBUTION TRANSFORMER LOSSES
Transformers are inductive in nature they consume the power with lagging power factor. But the key input
for estimating distribution transformer energy loss is the transformer load that determines the power factor and
energy consumed. The distribution transformer rated capacity does not reflect their actual consumption. Therefore,
there is no measured load record for distribution transformers when the feeder is supplying the energy. The loss due
to DT is of significance as it contributes to some percentage of total input units. Attempts may be made to minimize
these losses.
A. NO LOAD LOSSES (Wᵢ)
Taking place in iron/core part comprising of hysteresis losses and eddy current losses in the core considered to be
constant irrespective of load.
1)
Hysteresis losses:
Each time the magnetic field is reversed, a small amount of energy is lost due to hysteresis within the core.
According to Steinmetz's formula, the heat energy due to hysteresis is given by
And hysteresis loss is thus given by
Where f is the frequency, η is the hysteresis coefficient and βmax is the maximum flux density, the
empirical exponent of which varies from about 1.4 to 1 .8 but is often given as 1.6 for iron.
2) Eddy current loss:
The eddy current loss is a complex function of the square of supply frequency and square inverse of
the material thickness. Eddy current losses can be reduced by making the core of a stack of plates
electrically insulated from each other, rather than a solid block; all transformers operating at low
frequencies use laminated or similar cores.
B. WINDING LOSSES OR LOAD LOSS (Wwdg)
Takes place in the winding part. As a function of load current, can be divided into (I²R) loss and stray losses.
The stray losses are caused by eddy currents that produce stray electromagnetic flux in the windings, core, core
clamps, magnetic shield and other parts of the transformer.
3) Stray loss:
Leakage inductance is by itself largely lossless, since energy supplied to its magnetic fields is returned
to the supply with the next half-cycle. However, any leakage flux that intercepts nearby conductive
materials such as the transformer's support structure will give rise to eddy currents and be converted to
heat. There are also radioactive losses due to the oscillating magnetic field but these are usually small.
Mechanical vibration and audible noise transmission In addition to magnetostriction the alternating
magnetic field causes fluctuating forces between the primary and secondary windings. This energy
incites vibration transmission in interconnected metalwork, thus amplifying audible transformer hum.
ISSN: 2278-2311
© 2014, IJIRAE – All Rights Reserved
IJIRAE | http://ijirae.com
Page - 2
International Journal of Innovative Research in Advanced Engineering (IJIRAE)
Volume 1, Issue 1 (March 2014)
C. OTHER LOSSES (Wother)
Dielectric loss ( due to electrostatic reversal in insulation and circulating currents), load unbalance, oil
leakage, loss of life, lack of maintenance, improper up keep of distribution boxes, and joints loose
connections. Generally the value is less than 1% of total energy input to the system. The most
important losses are Wi and Wwdg. The other losses are described mainly to give a complete picture
on losses.
V. LOSS CALCULATION APPROACH
After replacing the High rating transformer with low rating value, by using the past data collected the loss
calculation is carried out. T = period of consideration (day/month/year,
KVAavg = average of recorded KVA from load curve =
D. LOAD FACTOR (Ld)
It is the ratio of the average KVA consumed during a designed period, to the maximum demand
MDKVA occurring in that same period. A system load factor measures the degree of utilization of the
power supply system. By increasing the system load factor, the need to provide larger building
transformer capacity may be avoided and the construction of new generating and transmission plant may
be delayed.
LOAD FACTOR = Ld F = (KVAavg / (MDKVA)
E.LOSS FACTOR (Ls Factor)
It describes the average electrical energy losses for electricity transmitted through T. Ideally, to calculate
the load losses it would be necessary to integrate the square of all momentary ratio of actual load to the
rated load. This is practically difficult.
LOSS FACTOR = LsFactor = LdF² + (0.273) (LdF – K) ²
Where K = (KVA min) / (KVA max) (as per load curve)
Now, Wwdg = Wc [(MDKVA) / (Tr KVA total)]² ( Ls Factor)
Where Wc = full load copper loss Wi and Wc can be obtained from the standard losses table available,
Tr KVA total = total rating of all transformer KVA.
Transformer energy losses are given by TRenloss = (Wi + Wwdg +Wother)
Total losses for all distribution transformers can then be calculated by summing the losses for individual
transformer as below: Total transformer energy losses =
VI. SAMPLE CASE STUDY
11KV alaiamman feeder of MAMBALAM SUBSTATION is considered as a sample case study. The
substation is located in main part of the city comprising of many number of houses and medium industries. Working
voltage of SS is 33KV/11KV having many feeders. Alaiamman feeder is selected for sample study. The period of
study was for one month (for 30 days) in November 2013. The feeder is drawn through a distance of 15 km. This
feeder circuit consists of 6 quantities of 250 KVA transformers and 5 quantities of 500 KVA transformers.
Firstly, the power system SS, its components like feeder and distribution transformer are discussed. Various losses
in distribution transformers are discussed. Next approach for estimating the losses of DT circuit is presented using
actual readings available and analytical method. A load profile based on the consumer’s data, is described. The
approach is implemented for the loss calculations. Results and conclusions are drawn on the basis of calculation.
ISSN: 2278-2311
© 2014, IJIRAE – All Rights Reserved
IJIRAE | http://ijirae.com
Page - 3
International Journal of Innovative Research in Advanced Engineering (IJIRAE)
Volume 1, Issue 1 (March 2014)
Period in days, fig 2.load curve
F. REPLACING THE EXISTING TRANSFORMER
Although the transformer capacity is loaded to recorded value up to collectively but considering the low values of
the factor, it can be noted that in terms of loading, the utility of transformer is very less.
G. NEED FOR REPLACING
Losses are more for high rated transformer groups. This is because they are connected to bulk LT
consumers. The network is large and covers many versatile type of machinery. Hence the losses are expected to be
more. Transformers of high ratings are connected to LT consumers. Compared to LT consumers, HT consumers are
less in number. In the alaiamman feeder circuit load connected is large but the load consumed is very less. In this
feeder circuit higher rated transformer is not all needed. Due to the excess of load more losses occurs and it reduces
the efficiency of the system. The 250 KVA transformers is replaced with 100 KVA transformer and 500 KVA
transformer is replaced with 250 KVA transformer to minimize the loss.By replacing the transformer the load is
connected according to the requirement. Thus the amount of load connected is utilized fully and losses can be
reduced to some extent. Energy conservation in HT sector is comparatively wide and easy.
SI.NO
TRANSFORMER
Wi (W)
Wc (W)
RATING KVA
1
100
350
2500
2
200
570
3300
3
250
748
3163
4
315
800
4600
5
500
1030
6860
6
1000
1800
11000
2000
3000
20000
7
TABLE 1 STANDARD TRANSFORMER LOSS TABLE
SL.
NO
1.
2.
TRANSFORMER
RATING KVA
100
250
TOTAL OVERALL
Tr KVA
QTY
TOTAL
KVA
6
5
11
600
1250
1850
PERCENTAGE
(%) OF
OVERALL
TOTAL
CAPACITY
32.43
67.56
TABLE 2 DETAILS OF TRANSFORMER USED
As per the load curve data, total consumption (SS import) is 27368000 units, 55500 KVA per month.
ISSN: 2278-2311
© 2014, IJIRAE – All Rights Reserved
IJIRAE | http://ijirae.com
Page - 4
International Journal of Innovative Research in Advanced Engineering (IJIRAE)
Volume 1, Issue 1 (March 2014)
After replacing the transformer the KVA overall KVA value to reduce to 1850 KVA. We have reduced 2150
KVA when compared to the existing system. The load is connected according to the need and the utility of
transformer is better, which obliviously reduces losses and improves the system efficiency.
F. DAILY ENERGY LOSS OF TOTAL TRANSFORMER CIRCUIT
SL.NO
TRANSFORMER
TYPE KVA
QTY
ENERGY LOSSES IN
WATTS (K WH)
Wi
Wwdg Wother
100
6
108
147
27
250
5
106.6 156.2
36.3
Total
214.6 303.2
63.3
TABLE 3 DAILY ENERGY LOSS OF TOTAL TRANSFORMER
1.
2.
TOTAL
UNITS
(KWH)
282
299.1
581.1
G. MONTHLY ENERGY LOSS OF TOTAL TRANSFORMER CIRCUIT
SL.NO
1.
2.
TRANSFORMER
TYPE KVA
QTY
ENERGY LOSSES IN
TOTAL UNITS
WATTS (KWH)
(KWH)
Wi
Wwdg
Wother
100
6
3240 4410
810
8460
250
5
3198 4686
1089
8973
Total
6438 9096
1899
17433
TABLE 4 MONTHLY ENERGY LOSS OF TOTAL TRANSFORMER CIRCUIT
H. RATING WISE TRANSFORMER LOSSES FOR ONE MONTH
SL.NO
1.
2.
TRANSFORMER RATING
PERCENTAGE (%) OF TOTAL INPUT
(KVA)
(IMPORT) UNITS KWH
100
0.18
250
0.39
TOTAL
0.57
TABLE 5 RATING WISE TRANSFORMER LOSSES FOR ONE MONTH
The table 5 shows losses of each group as percentage of total import units in the feeder.
VII. HT REGULATION OF PROPOSED SYSTEM
A HT REGULATION CHART OF 11KV M FEEDER FED BY 33/11 KV MAMBALAM SS IN CIT NAGAR II
SECTION
11KV
CABLE
SIZE
3*120
DISTAN
CE IN
KM
0.100
3*120
0.950
3*120
0.100
3*120
0.100
3*120
0.300
3*120
0.100
3*120
3*120
0.100
0.100
3*120
0.050
DISTRIBUTION
TRANSFORMER
CAPA
CITY
CUMULATIVE
LOAD
MOMENTUM
REGULATION
CRESENT PARK SS-II TP 250 KVA
CRESENT PARK SS-I- TP 250 KVA
HINDI PRACHAR SABHA
RMU-500 KVA
THANICKACHALAM ST
RMU
BURKIT RD SS-I- 500 KVA
BURKIT RD SS-II- 500
KVA (PROPOSED)
SARAVANA RMU – 250
KVA
LOTUS RING – 250 KVA
CANARA BANK TP-250
KVA
BURKIT ROAD RMU- 250
KVA
100
1850
185.00
0.0478
100
1750
1662.50
0.04298
250
1650
165.00
0.0427
500
1400
140.00
0.0362
500
900
270.00
0.0698
100
400
40.00
0.0103
100
100
300
200
30.00
20.00
0.0078
0.0052
100
100
5.00
0.0013
0.6508
TABLE 6 SHOWS A HT REGULATION CHART OF 11KV M FEEDER FED BY 33/11 KV MAMBALAM SS IN CIT NAGAR II SECTION
ISSN: 2278-2311
© 2014, IJIRAE – All Rights Reserved
IJIRAE | http://ijirae.com
Page - 5
International Journal of Innovative Research in Advanced Engineering (IJIRAE)
Volume 1, Issue 1 (March 2014)
The HT Regulation of 11 KV MHU feeder fed by 33/11 KV Mambalam SS works out 0.6508% with Diversity
factor. Hence Satisfactory
VIII CONCLUSION
The method used in this project makes use of the past data of the feeder circuit. By calculating the factors, the losses
can be easily calculated. A total loss due to transformer in feeder circuit is 0.71% of the total input to the substation.
This quantity of loss is seemingly little high as compared to normal losses of 0.5% in a feeder circuit. More losses in
present case can be attributed to poor maintenance and environmental aspects. If maintenance work is done with
planning at least 6000 units (0.14%) can be saved. It can be noted that losses are more for high rated transformer
groups. This is because they are connected to bulk LT consumers. The network is large and covers many versatile
types of machinery. Hence the losses are expected to be moretransformers of higher rating are connected to LT
consumers. Compared to HT consumers LT consumers are more and are cautious about energy saving activities.
Energy conservation in HT sector is comparatively wide and easy. If the entire higher rated transformer is replaced
with lower KVA value we could save 6000 units per month. The output is verified with the Etap software.
ACKNOWLEDGEMENT
We are very grateful to SHAKTHI Dr.G.B.Senthil Kumar, Correspondent, APEC for his encouragement and
inspiration. We thank our Principal, Dr.V.Ramasamy, for providing us all necessary facilities and for giving a
dynamic boost to the quality of project work undertaken. We wish to place our records, our sincere thanks and
gratitude to Dr.J.BASKARAN, Head of the Department, We render our wholehearted thanks to him. We are highly
indebted to Er.LAKSHMANAN, Assistant Engineer, and Chennai development circle, TANGEDCO for his
guidance and constant supervision as well as for providing necessary information regarding the project and also
support in completing the project.
REFERENCES
[1] V. A. Kulkarni and P. K Katti, “Estimation of Distribution Transformer Losses in Feeder Circuit”, International
Journal of Computer and Electrical Engineering, Vol. 3, No. 5, October 2011.
[2] M.H. Amrollahi , Electrical Engineering Department , Urmia University of Technology ,Urmia, Iran,
Amrollahi_mh @yahoo.com , S. Hassani , West Azerbayjan Power Distribution Company, Urmia, Iran,
sh592b@yahoo.com “ Determination losses and estimate life of distribution transformers with three
computational, measurement and simulation methods, despite harmonic loads”.
[3] K. Alekhya, P.S.R. Murthy and C. Bhargava, “Assessment of Reliability for Distribution Feeders on the Basis
of Cost Analysis”, Bonfring International Journal of Power Systems and Integrated Circuits, Vol. 1, Special
Issue, December 2011 .
[4] Jaya A. Keoliya, Prof. Mrs. G. A. Vaidya “Estimation Of TechnicalLosses In A Distribution
System”,
International Journal of Engineering Research & Technology (IJERT), ISSN: 2278-0181 www.ijert.orgVol. 2
Issue 6, June – 2013.
[5] K. V. S. Ramachandra Murthy and M. Ramalinga Raju,” Electrical Energy Loss In Rural Distribution FeedersA Case Study ”, ARPN Journal of Engineering and Applied Sciences, ISSN 1819-6608 , VOL. 4, NO. 2,
APRIL 2009
[6] Sarang Pande and Prof. Dr. J.G. Ghodekar, “ Computation of Technical Power Loss of Feeders and
Transformers in Distribution System using LoadFactor and Load Loss Factor”, International Journal Of
Multidisciplinary Sciences And Engineering, VOL. 3, No. 6, JUNE 2012.
ISSN: 2278-2311
© 2014, IJIRAE – All Rights Reserved
IJIRAE | http://ijirae.com
Page - 6


