IEEE Photonics Technology Letters - jalali
advertisement
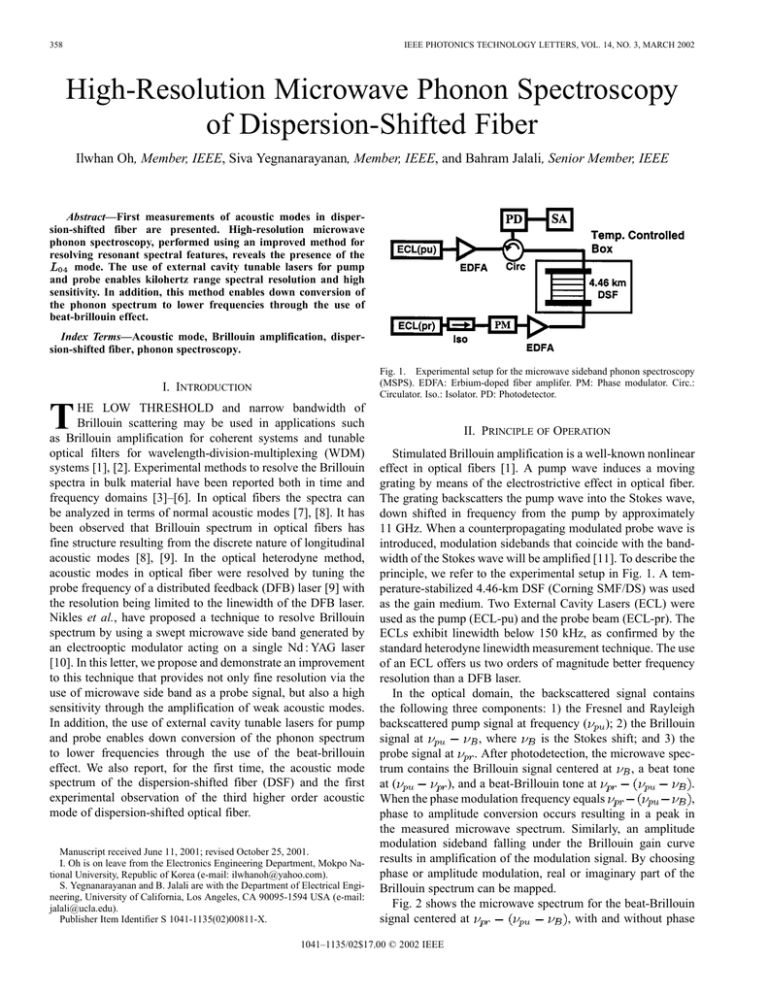
358 IEEE PHOTONICS TECHNOLOGY LETTERS, VOL. 14, NO. 3, MARCH 2002 High-Resolution Microwave Phonon Spectroscopy of Dispersion-Shifted Fiber Ilwhan Oh, Member, IEEE, Siva Yegnanarayanan, Member, IEEE, and Bahram Jalali, Senior Member, IEEE Abstract—First measurements of acoustic modes in dispersion-shifted fiber are presented. High-resolution microwave phonon spectroscopy, performed using an improved method for resolving resonant spectral features, reveals the presence of the 04 mode. The use of external cavity tunable lasers for pump and probe enables kilohertz range spectral resolution and high sensitivity. In addition, this method enables down conversion of the phonon spectrum to lower frequencies through the use of beat-brillouin effect. Index Terms—Acoustic mode, Brillouin amplification, dispersion-shifted fiber, phonon spectroscopy. Fig. 1. Experimental setup for the microwave sideband phonon spectroscopy (MSPS). EDFA: Erbium-doped fiber amplifer. PM: Phase modulator. Circ.: Circulator. Iso.: Isolator. PD: Photodetector. I. INTRODUCTION T HE LOW THRESHOLD and narrow bandwidth of Brillouin scattering may be used in applications such as Brillouin amplification for coherent systems and tunable optical filters for wavelength-division-multiplexing (WDM) systems [1], [2]. Experimental methods to resolve the Brillouin spectra in bulk material have been reported both in time and frequency domains [3]–[6]. In optical fibers the spectra can be analyzed in terms of normal acoustic modes [7], [8]. It has been observed that Brillouin spectrum in optical fibers has fine structure resulting from the discrete nature of longitudinal acoustic modes [8], [9]. In the optical heterodyne method, acoustic modes in optical fiber were resolved by tuning the probe frequency of a distributed feedback (DFB) laser [9] with the resolution being limited to the linewidth of the DFB laser. Nikles et al., have proposed a technique to resolve Brillouin spectrum by using a swept microwave side band generated by an electrooptic modulator acting on a single Nd : YAG laser [10]. In this letter, we propose and demonstrate an improvement to this technique that provides not only fine resolution via the use of microwave side band as a probe signal, but also a high sensitivity through the amplification of weak acoustic modes. In addition, the use of external cavity tunable lasers for pump and probe enables down conversion of the phonon spectrum to lower frequencies through the use of the beat-brillouin effect. We also report, for the first time, the acoustic mode spectrum of the dispersion-shifted fiber (DSF) and the first experimental observation of the third higher order acoustic mode of dispersion-shifted optical fiber. Manuscript received June 11, 2001; revised October 25, 2001. I. Oh is on leave from the Electronics Engineering Department, Mokpo National University, Republic of Korea (e-mail: ilwhanoh@yahoo.com). S. Yegnanarayanan and B. Jalali are with the Department of Electrical Engineering, University of California, Los Angeles, CA 90095-1594 USA (e-mail: jalali@ucla.edu). Publisher Item Identifier S 1041-1135(02)00811-X. II. PRINCIPLE OF OPERATION Stimulated Brillouin amplification is a well-known nonlinear effect in optical fibers [1]. A pump wave induces a moving grating by means of the electrostrictive effect in optical fiber. The grating backscatters the pump wave into the Stokes wave, down shifted in frequency from the pump by approximately 11 GHz. When a counterpropagating modulated probe wave is introduced, modulation sidebands that coincide with the bandwidth of the Stokes wave will be amplified [11]. To describe the principle, we refer to the experimental setup in Fig. 1. A temperature-stabilized 4.46-km DSF (Corning SMF/DS) was used as the gain medium. Two External Cavity Lasers (ECL) were used as the pump (ECL-pu) and the probe beam (ECL-pr). The ECLs exhibit linewidth below 150 kHz, as confirmed by the standard heterodyne linewidth measurement technique. The use of an ECL offers us two orders of magnitude better frequency resolution than a DFB laser. In the optical domain, the backscattered signal contains the following three components: 1) the Fresnel and Rayleigh backscattered pump signal at frequency ( ); 2) the Brillouin , where is the Stokes shift; and 3) the signal at . After photodetection, the microwave specprobe signal at , a beat tone trum contains the Brillouin signal centered at ), and a beat-Brillouin tone at . at ( , When the phase modulation frequency equals phase to amplitude conversion occurs resulting in a peak in the measured microwave spectrum. Similarly, an amplitude modulation sideband falling under the Brillouin gain curve results in amplification of the modulation signal. By choosing phase or amplitude modulation, real or imaginary part of the Brillouin spectrum can be mapped. Fig. 2 shows the microwave spectrum for the beat-Brillouin , with and without phase signal centered at 1041–1135/02$17.00 © 2002 IEEE OH et al.: HIGH-RESOLUTION MICROWAVE PHONON SPECTROSCOPY OF DSF 359 Fig. 2. Brillouin amplification of the modulation sideband. Inset shows the reference signal and the sideband. Fig. 4. Phonon spectra for two types of DSF. (a) With Corning SMF-DS. (b) With Corning SMF-LS. Fig. 3. Measured phonon spectra of DSF. (a) Probe power: 2 dBm. Pump power: 13 dBm. (b) Probe power: 9 dBm. Pump power: 13 dBm. modulation. The gain spectrum of the DSF was measured to be 10.5 GHz with a FWHM, 25 MHz. centered at When the phase modulation is on and its frequency lies within the beat-Brillouin spectrum, a strong narrow linewidth signal, is observed. By sweeping the at the modulation frequency modulation sideband through the Brillouin gain spectrum, we can resolve discrete acoustic modes of the fiber. The linewidth of the side-mode is measured to be less than 30 kHz and is limited by the resolution bandwidth of the spectrum analyzer and the linewidth of the microwave source as verified by comparing the side-mode and the microwave reference directly from microwave source (see inset). We note that there are two dominant sidebands in a phase modulation ( 1 sideband). In this letter, we refer to the higher frequency tone as the blue sideband, and the lower frequency tone as the red sideband. By tuning the probe laser, we can scan the Brillouin spectrum with the blue or the red sidebands. As will be seen in Figs. 3 and 4 the blue-sideband and red-sideband spectra are mirror images of each other. Fig. 3 shows the measured Brillouin gain for the DSF using the blue sideband. The pump power was set at 13 dBm. The optical phase modulator had a bandwidth of 8 GHz and was driven by a sinusoidal signal whose frequency was varied across the phonon sideband, while its amplitude was kept at 10 dBm corresponding to a peak-to-peak amplitude of 2 V. The probe power was 2 dBm for Fig. 3(a) and 9 dBm for Fig. 3(b). As shown in Fig. 3(a), we observe two side lobes in addition to the main peak in the Brillouin gain spectrum. The separation between the peak Fig. 5. Phonon spectrum of DSF with different microwave modulation power. (a) 20 dBm. (b) 10 dBm. + + and the adjacent sidelobe is about 250 MHz, while the two lobes are apart by 210 MHz. These three peaks are very similar to the spectra reported in [9]. Comparing this with the calculated acoustic dispersion relation in [7], [9], we identify the peaks , – , and – longitudinal a, b and c with the modes, respectively. With a higher probe power in Fig. 3(b), we can clearly observe, for the first time, a fourth acoustic mode – mode. This mode, labeled as spaced by 150 MHz from – mode with a power that is about d, can be identified as – mode. The lower amplitude of 10 dB lower than the opthis mode is due to the weaker overlap between the – acoustic mode [12]. tical mode-field and the To further demonstrate the usefulness of the high-resolution microwave phonon spectroscopy technique, we characterized two different types of DSFs. We use Corning SMF-DS and SMF-LS fibers having Stokes frequencies (at 1550-nm pump wavelength) of 10.55 and 10.58 GHz, respectively. Fig. 4 shows the comparison of the longitudinal acoustic modes using the – mode in SMF-LS is 100 MHz away red sideband. The mode. The three lower modes, namely the from the , – , and – longitudinal modes, are similar in modes in these fibers are offset these fibers. However, the by about 50 MHz. Fig. 5 shows the measured acoustic mode spectra with microwave input as a variable for the SMF-DS using the red sideband. As we increase microwave power from 10 to 20 dBm, we observe a 10-dB gain increment in the side-modes, while the mode remains unchanged. In addition, the – mode 360 IEEE PHOTONICS TECHNOLOGY LETTERS, VOL. 14, NO. 3, MARCH 2002 peak rises above the measurement noise floor only at the higher microwave power. The dependence of Brillouin spectra on microwave power, leading to the observed phenomena, is under investigation. A possible cause is gain saturation in the Brillouin gain medium. III. CONCLUSION We report the first measurements of the acoustic mode spectrum of DSF. Using an improved technique to perform microwave phonon spectroscopy that provides high sensitivity and high spectral resolution, we report the first observation mode in DSF. It is well known that the of the acoustic acoustic mode spectrum is sensitive to the fiber-doping profile and geometry. Therefore, high-resolution high-sensitivity Brillouin spectroscopy is a valuable tool that could be useful in development of new optical fibers. REFERENCES [1] G. P. Agrawal, Nonlinear Fiber Optics, 2nd ed. New York: Academic, 1995. [2] A. R. Chraplyvy and R. W. Tkach, “Narrowband tunable optical filter for channel selection in densely packed WDM systems,” Electron. Lett., vol. 22, pp. 1084–1085, 1986. [3] Y. Yan and K. A. Nelson, “Impulsive stimulated light scattering. I. General theory,” J. Chem. Phys., vol. 87, pp. 6240–6256, 1987. [4] A. G. Jacobson and Y. R. Shen, “Coherent Brillouin spectroscopy,” Appl. Phys. Lett., vol. 34, pp. 464–467, 1979. [5] W. T. Grubbs and R. A. MacPhail, “Dynamics in supercooled glycerol by high resolution stimulated Brillouin gain spectroscopy,” J. Chem. Phys., vol. 100, no. 4, pp. 2561–2270, 1994. [6] J. Czarske and I. Muller, “Heterodyne detection technique using stimulated Brillouin scattering and a multimode laser,” Opt. Lett., vol. 19, pp. 1589–1591, 1994. [7] C. K. Jen, A. Safaai-Jazi, and G. W. Farnell, “Leaky modes in weakly guiding fiber acoustic waveguides,” IEEE Trans. Ultrason. Ferroelectr., vol. UFFC-33, pp. 634–643, 1986. [8] P. J. Thomas, N. L. Rowel, H. M. van Driel, and G. I. Stegeman, “Normal acoustic modes and Brillouin scattering in single mode optical fibers,” Phys. Rev. B, vol. 19, pp. 4986–4998, 1979. [9] N. Shibata, Y. Azuma, T. Horiguchi, and M. Tateda, “Identification of longitudinal acoustic modes guided in the core region of a single mode optical fiber by Brillouin gain spectra measurements,” Opt. Lett., vol. 13, pp. 595–597, July 1988. [10] M. Nikles, L. Thevenaz, and P. A. Robert, “Brillouin gain spectrum characterization in single mode optical fiber,” J. Lightwave Technol., vol. 15, pp. 1842–1851, Oct. 1997. [11] X. S. Yao, “Brillouin selective sideband amplification of microwave photonic signals,” IEEE Photon. Technol. Lett., vol. 10, pp. 138–140, Jan. 1998. [12] C. K. Jen, J. E. B. Oliveira, N. Goto, and K. Abe, “Role of guided acoustic wave properties in a single mode optical fiber design,” Electron. Lett., vol. 24, pp. 1419–1420, 1988.
