Applications in Ch1
advertisement
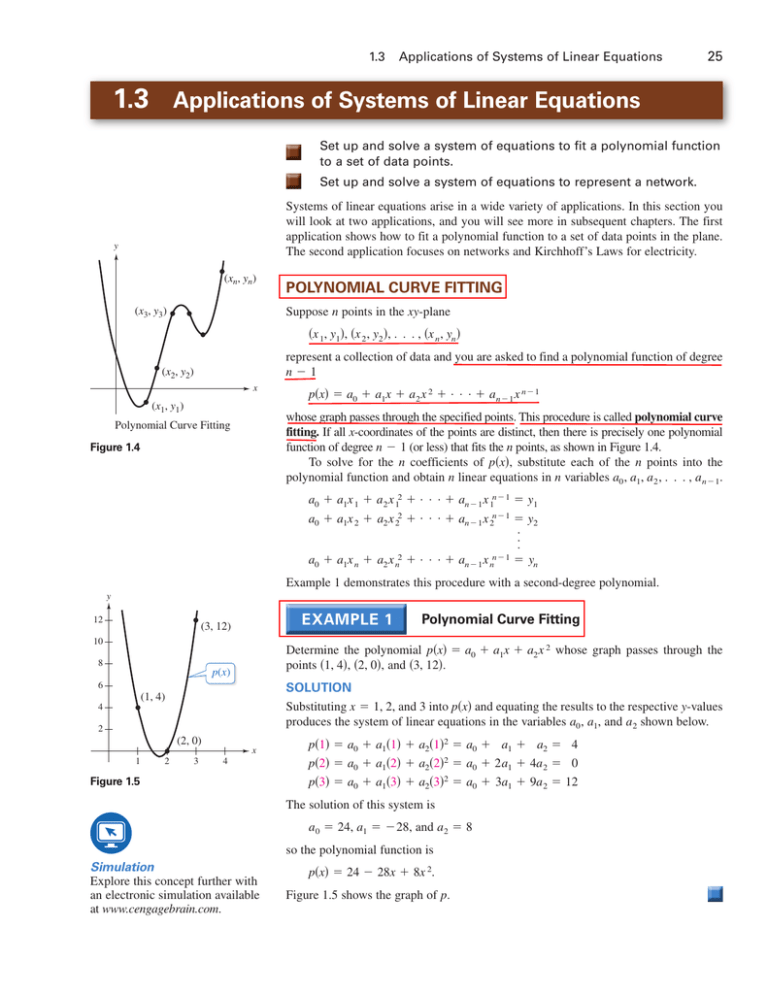
1.3 Applications of Systems of Linear Equations 25 1.3 Applications of Systems of Linear Equations Set up and solve a system of equations to fit a polynomial function to a set of data points. Set up and solve a system of equations to represent a network. Systems of linear equations arise in a wide variety of applications. In this section you will look at two applications, and you will see more in subsequent chapters. The first application shows how to fit a polynomial function to a set of data points in the plane. The second application focuses on networks and Kirchhoff’s Laws for electricity. y (xn, yn) (x3, y3) POLYNOMIAL CURVE FITTING Suppose n points in the xy-plane sx 1, y1d, sx 2 , y2 d, . . . , sx n , yn d represent a collection of data and you are asked to find a polynomial function of degree n21 (x2, y2) x (x1, y1) psxd 5 a0 1 a1x 1 a2 x 2 1 . . . 1 an21 x n21 whose graph passes through the specified points. This procedure is called polynomial curve fitting. If all x-coordinates of the points are distinct, then there is precisely one polynomial function of degree n 2 1 (or less) that fits the n points, as shown in Figure 1.4. To solve for the n coefficients of psxd, substitute each of the n points into the polynomial function and obtain n linear equations in n variables a0 , a1, a2 , . . . , an21. Polynomial Curve Fitting Figure 1.4 a0 1 a1x 1 1 a2 x 12 1 . . . 1 an21 x 1n21 5 y1 a0 1 a1x 2 1 a2 x 22 1 . . . 1 an21 x 2n21 5 y2 . . . a0 1 a1x n 1 a2 x n2 1 . . . 1 an21 x nn21 5 yn Example 1 demonstrates this procedure with a second-degree polynomial. y 12 Polynomial Curve Fitting (3, 12) 10 Determine the polynomial psxd 5 a0 1 a1x 1 a2 x 2 whose graph passes through the points s1, 4d, s2, 0d, and s3, 12d. 8 p(x) 6 SOLUTION Substituting x 5 1, 2, and 3 into psxd and equating the results to the respective y-values produces the system of linear equations in the variables a0 , a1, and a2 shown below. (1, 4) 4 2 (2, 0) x 1 2 3 4 Figure 1.5 ps1d 5 a0 1 a1s1d 1 a2s1d2 5 a0 1 a1 1 a2 5 4 ps2d 5 a0 1 a1s2d 1 a2s2d2 5 a0 1 2a1 1 4a 2 5 0 ps3d 5 a0 1 a1s3d 1 a2s3d2 5 a0 1 3a1 1 9a 2 5 12 The solution of this system is a0 5 24, a1 5 228, and a2 5 8 so the polynomial function is Simulation Explore this concept further with an electronic simulation available at www.cengagebrain.com. psxd 5 24 2 28x 1 8x 2. Figure 1.5 shows the graph of p. 26 Chapter 1 Systems of Linear Equations Polynomial Curve Fitting Find a polynomial that fits the points s22, 3d, s21, 5d, s0, 1d, s1, 4d, and s2, 10d. SOLUTION Because you are given five points, choose a fourth-degree polynomial function psxd 5 a0 1 a1x 1 a2 x 2 1 a3 x 3 1 a4 x 4. Substituting the given points into psxd produces the following system of linear equations. a0 2 2a1 1 4a2 2 8a3 1 16a4 a0 2 a1 1 a2 2 a3 1 a4 a0 a0 1 a1 1 a2 1 a3 1 a4 y (2, 10) 10 p(x) The solution of these equations is 4 a0 5 1, (1, 4) x Figure 1.6 30 a1 5 2 24 , 101 a2 5 24 , 18 a3 5 24 , 17 a4 5 2 24 which means the polynomial function is (0, 1) −3 3 5 1 4 a0 1 2a1 1 4a2 1 8a3 1 16a4 5 10 8 (− 1, 5) (−2, 3) 5 5 5 5 −1 1 2 30 18 3 17 4 2 psxd 5 1 2 24 x 1 101 24 x 1 24 x 2 24 x 1 5 24 s24 2 30x 1 101x 2 1 18x 3 2 17x 4d. Figure 1.6 shows the graph of p. The system of linear equations in Example 2 is relatively easy to solve because the x-values are small. For a set of points with large x-values, it is usually best to translate the values before attempting the curve-fitting procedure. The next example demonstrates this approach. Translating Large x-Values Before Curve Fitting Find a polynomial that fits the points sx 1, y1d sx 2, y2 d sx 3, y3d sx 4, y4 d sx 5, y5 d s2006, 3d, s2007, 5d, s2008, 1d, s2009, 4d, s2010, 10d. SOLUTION Because the given x-values are large, use the translation z 5 x 2 2008 to obtain sz 1, y1d sz 2 , y2d sz 3 , y3d sz 4 , y4d sz 5 , y5 d s22, 3d, s21, 5d, s0, 1d, s1, 4d, s2, 10d. This is the same set of points as in Example 2. So, the polynomial that fits these points is 1 pszd 5 24 s24 2 30z 1 101z 2 1 18z 3 2 17z 4d 3 3 17 4 2 5 1 2 45 z 1 101 24 z 1 4 z 2 24 z . Letting z 5 x 2 2008, you have 3 17 2 3 4 psxd 5 1 2 45 sx 2 2008d 1 101 24 sx 2 2008d 1 4 sx 2 2008d 2 24 sx 2 2008d . 1.3 Applications of Systems of Linear Equations 27 An Application of Curve Fitting Find a polynomial that relates the periods of the three planets that are closest to the Sun to their mean distances from the Sun, as shown in the table. Then test the accuracy of the fit by using the polynomial to calculate the period of Mars. (In the table, the mean distance is given in astronomical units, and the period is given in years.) Planet Mercury Venus Earth Mars Mean Distance 0.387 0.723 1.000 1.524 Period 0.241 0.615 1.000 1.881 SOLUTION Begin by fitting a quadratic polynomial function psxd 5 a0 1 a1x 1 a2 x 2 to the points s0.387, 0.241d, s0.723, 0.615d, and s1, 1d. The system of linear equations obtained by substituting these points into psxd is a0 1 0.387a1 1 s0.387d2a2 5 0.241 a0 1 0.723a1 1 s0.723d2a2 5 0.615 a0 1 a1 1 a2 5 1. The approximate solution of the system is a0 < 20.0634, a1 < 0.6119, a2 < 0.4515 which means that an approximation of the polynomial function is psxd 5 20.0634 1 0.6119x 1 0.4515x 2. Using psxd to evaluate the period of Mars produces ps1.524d < 1.918 years. Note that the actual period of Mars is 1.881 years. Figure 1.7 compares the estimate with the actual period graphically. y Period (in years) 2.0 (1.524, 1.881) y = p(x) 1.5 Earth 1.0 Venus 0.5 Mars (1.000, 1.000) (0.723, 0.615) Mercury (0.387, 0.241) x 0.5 1.0 1.5 2.0 Mean distance from the Sun (in astronomical units) Figure 1.7 28 Chapter 1 Systems of Linear Equations As illustrated in Example 4, a polynomial that fits some of the points in a data set is not necessarily an accurate model for other points in the data set. Generally, the farther the other points are from those used to fit the polynomial, the worse the fit. For instance, the mean distance of Jupiter from the Sun is 5.203 astronomical units. Using psxd in Example 4 to approximate the period gives 15.343 years—a poor estimate of Jupiter’s actual period of 11.860 years. The problem of curve fitting can be difficult. Types of functions other than polynomial functions may provide better fits. For instance, look again at the curve-fitting problem in Example 4. Taking the natural logarithms of the given distances and periods produces the following results. Planet Mercury Mean Distance xxc ln x 0.387 0.723 20.949 20.324 0.241 0.615 21.423 20.486 Period x yc ln y Venus Earth Mars 1.000 1.524 0.0 0.421 1.000 1.881 0.0 0.632 Now, fitting a polynomial to the logarithms of the distances and periods produces the linear relationship ln y 5 23 ln x shown in Figure 1.8. ln y 2 ln y = 3 ln x 2 1 Mars Earth −2 Venus Mercury ln x 1 2 −1 −2 Figure 1.8 From ln y 5 32 ln x, it follows that y 5 x 3y2, or y 2 5 x 3. In other words, the square of the period (in years) of each planet is equal to the cube of its mean distance (in astronomical units) from the Sun. Johannes Kepler first discovered this relationship in 1619. LINEAR ALGEBRA APPLIED Researchers in Italy studying the acoustical noise levels from vehicular traffic at a busy three-way intersection on a college campus used a system of linear equations to model the traffic flow at the intersection. To help formulate the system of equations, “operators” stationed themselves at various locations along the intersection and counted the numbers of vehicles going by. (Source: Acoustical Noise Analysis in Road Intersections: A Case Study, Guarnaccia, Claudio, Recent Advances in Acoustics & Music, Proceedings of the 11th WSEAS International Conference on Acoustics & Music: Theory & Applications, June, 2010) gemphotography/Shutterstock.com 1.3 Applications of Systems of Linear Equations 29 NETWORK ANALYSIS Networks composed of branches and junctions are used as models in such fields as economics, traffic analysis, and electrical engineering. In a network model, you assume that the total flow into a junction is equal to the total flow out of the junction. For instance, the junction shown in Figure 1.9 has 25 units flowing into it, so there must be 25 units flowing out of it. You can represent this with the linear equation x 1 1 x 2 5 25. x1 25 x2 Figure 1.9 Because each junction in a network gives rise to a linear equation, you can analyze the flow through a network composed of several junctions by solving a system of linear equations. Example 5 illustrates this procedure. Analysis of a Network 20 1 x3 x2 x1 2 x4 3 10 4 Figure 1.10 10 x5 5 Set up a system of linear equations to represent the network shown in Figure 1.10. Then solve the system. SOLUTION Each of the network’s five junctions gives rise to a linear equation, as follows. x1 1 x2 5 20 5 220 5 20 2 x 5 5 210 2x 4 1 x 5 5 210 Junction 1 Junction 2 Junction 3 Junction 4 Junction 5 x3 2 x4 x2 1 x3 x1 The augmented matrix for this system is 3 1 0 0 1 0 1 0 1 0 0 0 1 1 0 0 0 21 0 0 21 4 0 20 0 220 0 20 . 21 210 1 210 Gauss-Jordan elimination produces the matrix 3 1 0 0 0 0 0 1 0 0 0 0 0 1 0 0 0 0 0 1 0 4 21 210 1 30 21 210 . 21 10 0 0 From the matrix above, you can see that x 1 2 x 5 5 210, x 2 1 x 5 5 30, x3 2 x5 5 210, and x 4 2 x 5 5 10. Letting t 5 x 5 , you have x 1 5 t 2 10, x 2 5 2t 1 30, x 3 5 t 2 10, x 4 5 t 1 10, x 5 5 t where t is any real number, so this system has infinitely many solutions. 30 Chapter 1 Systems of Linear Equations In Example 5, suppose you could control the amount of flow along the branch labeled x 5. Using the solution of Example 5, you could then control the flow represented by each of the other variables. For instance, letting t 5 10 would reduce the flow of x 1 and x 3 to zero, as shown in Figure 1.11. 20 1 0 20 0 2 20 3 10 4 10 10 5 Figure 1.11 REMARK A closed path is a sequence of branches such that the beginning point of the first branch coincides with the end point of the last branch. You may be able to see how the type of network analysis demonstrated in Example 5 could be used in problems dealing with the flow of traffic through the streets of a city or the flow of water through an irrigation system. An electrical network is another type of network where analysis is commonly applied. An analysis of such a system uses two properties of electrical networks known as Kirchhoff’s Laws. 1. All the current flowing into a junction must flow out of it. 2. The sum of the products IR (I is current and R is resistance) around a closed path is equal to the total voltage in the path. In an electrical network, current is measured in amperes, or amps sAd, resistance is measured in ohms sVd, and the product of current and resistance is measured in volts sV d. The symbol represents a battery. The larger vertical bar denotes where the current flows out of the terminal. The symbol denotes resistance. An arrow in the branch indicates the direction of the current. Analysis of an Electrical Network I1 R1 = 3 Ω I2 7V Determine the currents I1, I2 , and I3 for the electrical network shown in Figure 1.12. SOLUTION Applying Kirchhoff’s first law to either junction produces Path 1 1 2 R2 = 2 Ω I3 R3 = 4 Ω Figure 1.12 Path 2 8V I1 1 I3 5 I2 Junction 1 or Junction 2 and applying Kirchhoff’s second law to the two paths produces R1I1 1 R2I2 5 3I1 1 2I2 5 7 R2I2 1 R3I3 5 2I2 1 4I3 5 8. Path 1 Path 2 So, you have the following system of three linear equations in the variables I1, I2, and I3. I1 2 I2 1 I3 5 0 3I1 1 2I2 57 2I2 1 4I3 5 8 Applying Gauss-Jordan elimination to the augmented matrix 3 1 3 0 21 2 2 1 0 4 0 7 8 4 produces the reduced row-echelon form 3 1 0 0 0 1 0 0 0 1 1 2 1 4 which means I1 5 1 amp, I2 5 2 amps, and I3 5 1 amp. 1.3 Applications of Systems of Linear Equations 31 Analysis of an Electrical Network Determine the currents I1, I2, I3, I4, I5, and I6 for the electrical network shown in Figure 1.13. 17 V R 4 = 2 Ω 2 Path 1 I1 Path 2 R 2 = 4Ω I2 R1 = 2Ω 4 I4 10 V 14 V Path 3 I5 I6 R 6 = 4Ω R 5 = 2Ω R3 = 1Ω 1 3 I3 Figure 1.13 SOLUTION Applying Kirchhoff’s first law to the four junctions produces I1 I1 I3 I4 1 I3 1 I4 1 I6 1 I6 5 5 5 5 I2 I2 I5 I5 Junction 1 Junction 2 Junction 3 Junction 4 and applying Kirchhoff’s second law to the three paths produces 2I1 1 4I2 5 10 4I2 1 I3 1 2I4 1 2I5 5 17 2I5 1 4I6 5 14. Path 1 Path 2 Path 3 You now have the following system of seven linear equations in the variables I1, I2, I3, I4, I5, and I6. I1 2 I2 1 I3 5 0 I1 2 I2 1 I4 5 0 I3 2 I5 1 I6 5 0 I4 2 I5 1 I6 5 0 2I1 1 4I2 5 10 4I2 1 I3 1 2I4 1 2I5 5 17 2I5 1 4I6 5 14 The augmented matrix for this system is 3 1 1 0 0 2 0 0 21 21 0 0 4 4 0 1 0 1 0 0 1 0 0 1 0 1 0 2 0 0 0 21 21 0 2 2 0 0 1 1 0 0 4 4 0 0 0 0 . 10 17 14 Using Gauss-Jordan elimination, a graphing utility, or a software program, solve this system to obtain I1 5 1, I2 5 2, I3 5 1, I4 5 1, I5 5 3, and I6 5 2 meaning I1 5 1 amp, I2 5 2 amps, I3 5 1 amp, I4 5 1 amp, I5 5 3 amps, and I6 5 2 amps.
