CORENDERING THREE ATTRIBUTES AGAINST RED
advertisement

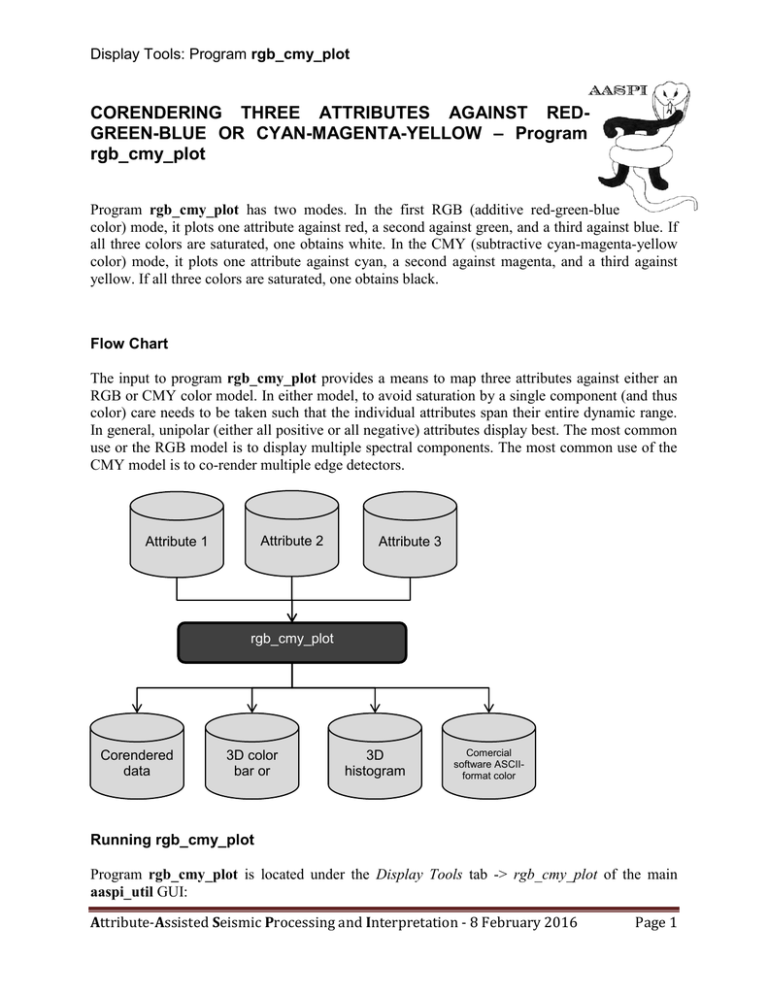
Display Tools: Program rgb_cmy_plot CORENDERING THREE ATTRIBUTES AGAINST REDGREEN-BLUE OR CYAN-MAGENTA-YELLOW – Program rgb_cmy_plot Program rgb_cmy_plot has two modes. In the first RGB (additive red-green-blue color) mode, it plots one attribute against red, a second against green, and a third against blue. If all three colors are saturated, one obtains white. In the CMY (subtractive cyan-magenta-yellow color) mode, it plots one attribute against cyan, a second against magenta, and a third against yellow. If all three colors are saturated, one obtains black. Flow Chart The input to program rgb_cmy_plot provides a means to map three attributes against either an RGB or CMY color model. In either model, to avoid saturation by a single component (and thus color) care needs to be taken such that the individual attributes span their entire dynamic range. In general, unipolar (either all positive or all negative) attributes display best. The most common use or the RGB model is to display multiple spectral components. The most common use of the CMY model is to co-render multiple edge detectors. Attribute 2 Attribute 1 Attribute 3 rgb_cmy_plot Corendered data volume 3D color bar or wheel 3D histogram Comercial software ASCIIformat color maps Running rgb_cmy_plot Program rgb_cmy_plot is located under the Display Tools tab -> rgb_cmy_plot of the main aaspi_util GUI: Attribute-Assisted Seismic Processing and Interpretation - 8 February 2016 Page 1 Display Tools: Program rgb_cmy_plot The following GUI appears: Attribute-Assisted Seismic Processing and Interpretation - 8 February 2016 Page 2 Display Tools: Program rgb_cmy_plot Plotting spectral components against the RGB color model To begin I chose three input attributes which are the 14, 34, and 54 Hz spectral components generated by the program spec_cmp for the Boonsville data volume. (1) I chose the spec_mag_3d_cmp_boonsville_0_14.00.H attribute to be plotted against the red axis. (2) I chose the spec_mag_3d_cmp_boonsville_0_34.00.H attribute to be plotted against the green axis and lastly (3) I chose the spec_mag_3d_cmp_boonsville_0_54.00.H attribute to be plotted against the blue axis. Most interpretation workstations only allow the importation of 256 colors as of September 2009. Therefore leave the color size as the default (4). Then select (5) to execute. The following image appears: Because of the 8-bit color limitation, the image is less then satisfactory. Therefore I plotted 256 colors for each of the axes (red, green, and blue). A 3D histogram appears shown below are different slices: Attribute-Assisted Seismic Processing and Interpretation - 8 February 2016 Page 3 Display Tools: Program rgb_cmy_plot Next, a 3D color bar appears shown below are different slices: Attribute-Assisted Seismic Processing and Interpretation - 8 February 2016 Page 4 Display Tools: Program rgb_cmy_plot Attribute-Assisted Seismic Processing and Interpretation - 8 February 2016 Page 5 Display Tools: Program rgb_cmy_plot Lastly, the final image looked like The above image with 16,777,271 colors is much smoother compared to the unsatisfactory image using only 256 colors. The karst collapse features are readily seen and the edges are highlighted in black. Plotting spectral components against the CMY color model Attribute-Assisted Seismic Processing and Interpretation - 8 February 2016 Page 6 Display Tools: Program rgb_cmy_plot To change from the RGB to the CMY color model, (1) click the tab that defines the color model. The GUI should look something like this: 1 2 3 4 5 6 Again, I chose three input attributes which are the energy ratio similarity, dip magnitude, and the most positive curvature (k1) from the Parihaka New Zealand data volume. These can be calculated from similarity, dip3D, and curvature. (2) I chose the Attribute-Assisted Seismic Processing and Interpretation - 8 February 2016 Page 7 Display Tools: Program rgb_cmy_plot energy_ratio_similarity_meters_1-2.H attribute to be plotted against the cyan axis. (3) I chose the dip_magnitude_meters_1-2_1-2.H attribute to be plotted against the magenta axis and lastly (4) I chose the k1_meters_long_w.H attribute to be plotted against the yellow axis. Most interpretation workstations only allow the importation of 256 colors as of September 2009. However, here I am able to display 256 colors along each axis so a total of 16,777,216 colors shown by block arrow (5). Then select (6) to execute. The following images for the 3D histogram, 3D color bar, and the final plot should appear: Attribute-Assisted Seismic Processing and Interpretation - 8 February 2016 Page 8 Display Tools: Program rgb_cmy_plot Next a 3D color bar appears which is shown below Attribute-Assisted Seismic Processing and Interpretation - 8 February 2016 Page 9 Display Tools: Program rgb_cmy_plot Attribute-Assisted Seismic Processing and Interpretation - 8 February 2016 Page 10 Display Tools: Program rgb_cmy_plot Attribute-Assisted Seismic Processing and Interpretation - 8 February 2016 Page 11 Display Tools: Program rgb_cmy_plot The CMY color model is good for enhancing edge like features such as the listric fault that is indicated by the black arrow in the above image. With 256 colors displayed on each axis the image is smoother compared to an image with only 256 colors displayed total. Theory The initial development and deployment of color hardware in the geophysical industry began by a need to display seismic attributes on the same image as the wiggle traces (Guo, et al.). Color display has evolved significantly over the years the basic color models have remained the same. Cyan-magenta-yellow-black is used for printing and red-green-blue is used for active screen display. RGB is an additive color model where red, green, and blue are light primaries that are mixed to produce other colors. While the CMY is a subtractive color model where cyan, magenta, and yellow are mixed to reproduce other colors which is the working model for printers. The RGB model has a greater range of human color perception compared to CMY. The RGB color model is a very good method for rendering three attributes with similar units and value range. The attributes can be combined using CMY to enhance edge features such as faults. References Marfurt, K. J., 2015, Techniques and best practices in multiattribute display: Interpretation, 3, 124. Hao Guo, Sean Lewis, and Kurt J. Marfurt (2008). ”Mapping multiple attributes to three- and four-component color models — A tutorial.” GEOPHYSICS, 73(3), W7-W19. Attribute-Assisted Seismic Processing and Interpretation - 8 February 2016 Page 12


