Technical Note: Gene Expression Profiling
The Power of Replicates
Introduction
In a typical gene expression study, researchers are interested in genes
expressed above background levels, and genes that are differentially
expressed between conditions of interest. The variation present in microarray data poses the challenge of determining whether differences
between expression measurements are caused by biological differences, or by statistical chance. The best way to address this challenge
is to use replicates for each condition studied. There are two primary
types of replicates: technical and biological. Technical replicates
involve taking one sample from the same source tube, and analyzing it
across multiple conditions, e.g., analyzing one sample six times across
multiple arrays. Biological replicates are different samples measured
across multiple conditions, e.g., six different human samples across
six arrays.
Using replicates offers three major advantages:
• Replicates can be used to measure variation in the experiment
so that statistical tests can be applied to evaluate differences.
• A
veraging across replicates increases the precision of gene
expression measurements and allows smaller changes to be
detected.
• R
eplicates can be compared to locate outlier results that may occur due to aberrations within the array, the sample, or the experimental procedure.
The high cost of microarrays has typically constrained or eliminated
the number of replicates in most studies. However, the cost must be
evaluated against the quality of the data, which includes ease of use,
initial financial outlay, cost of arrays and reagents, and experimental
design (e.g., replicates assayed). A more informative experiment may
be achieved by assaying a smaller set of test conditions while including more replicates rather than assaying a larger set of test conditions
with fewer replicates.
BENEFITS
7000
6000
Differentially Expressed Genes
Carefully designing and controlling experiments is as important as the
execution of the experiment itself. One approach that ensures greater
experimental success in gene expression studies using microarrays is
the incorporation of replicates. Replication of conditions lends statistical power that increases the confidence of the conclusions drawn
from these experiments. This text discusses the many ways in which
researchers can benefit from using replicates in their studies.
Figure 1: Differentially Expressed Genes As A Function Of Replicates
5000
4000
3000
2000
1000
1
2
3
4
5
6
Number of samples in Each Group
Increasing the number of biological replicates in each group enhances the
power to detect differentially expressed genes.
significant differential expression. If the data distribution is unclear,
non-parametric tests such as the Mann-Whitney test can be applied.
Several publications make specific recommendations on the number
of replicates required to detect various fold changes3,4.
B. Increase Precision
Averaging across replicates enhances the precision of measurements.
If the standard deviation of an expression measurement is s, then
the standard deviation of the average across n replicates is. As the
number of replicates increases, both the detectable difference from
background and the detectable fold change decrease.
C. Detect Outliers
The presence of outlier samples can have a severe impact on the
interpretation of data. Most array platforms have internal controls that
detect various problems in an experiment. However, internal controls may not identify all issues. A more powerful approach is also to
consider the correlation between replicates. Subtle problems with the
array, the sample, or the experimental procedure often become obvious in a pair-wise plot of replicate measurements.
A. Measure Variation
Data
Replicates improve the measurement of variation. Normally, if only one
array exists per condition, then fold change is used to determine differential expression. However, the variation of the expression level for
each gene is different and unknown. Multiple studies have shown that
fold change on its own is an unreliable indicator1,2. If multiple measurements (i.e., replicates) exist for each gene within each condition, the
measurement of variation can be estimated. If the data follow
an approximately normal distribution, the t-test or its variants reveal
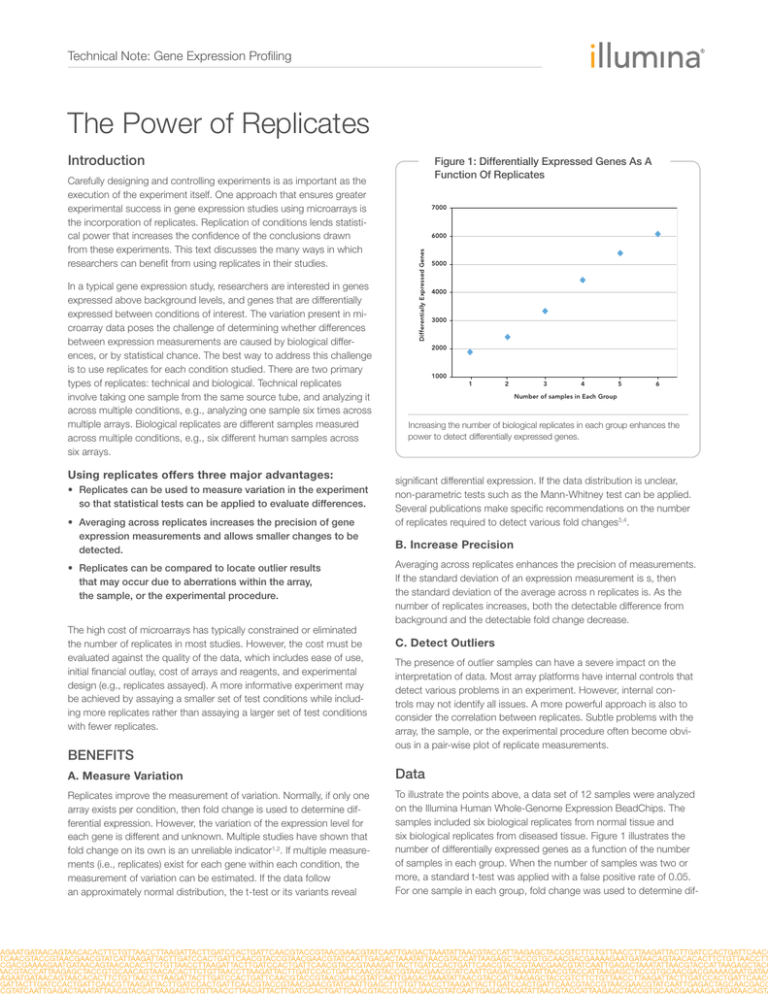
To illustrate the points above, a data set of 12 samples were analyzed
on the Illumina Human Whole-Genome Expression BeadChips. The
samples included six biological replicates from normal tissue and
six biological replicates from diseased tissue. Figure 1 illustrates the
number of differentially expressed genes as a function of the number
of samples in each group. When the number of samples was two or
more, a standard t-test was applied with a false positive rate of 0.05.
For one sample in each group, fold change was used to determine dif-
Technical Note: Gene Expression Profiling
Figure 2: Identification Of Outliers 6
r 2 = 0.97
Normal Sample 2 ( x104 )
4
2
0
-2
-1
0
1
2
3
4
5
3
4
5
4
Normal Sample 1 ( x10 )
6
r 2 = 0.97
Outlier Sample 1 ( x104 )
4
2
0
-2
-1
0
1
2
4
Normal Sample 1 ( x10 )
By plotting correlation plots between replicates, outlier samples may be identified (top) that are not apparent without a replicate comparison (bottom).
Technical Note: Gene Expression Profiling
Table 1: Differently Expressed Genes Identified
Under Various Conditions
Between Normal Samples
Between Normal
And Disease
Fold change,
no outlier
554
1,906
t-test: 3 replicates, no
outlier
559
3,377
Fold change
with outlier
1,898
3,259
t-test: 3 replicates with
outlier
503
2,640
ferential expression. The fold change required for significance was set
to achieve the same false positive rate as that used in the t-test.
The effect and treatment of outliers on a data set can be illustrated as
follows. Normal samples were divided into two groups of three. Three
disease samples were selected. Random noise was added to one
of the normal samples to simulate an outlier, and differential expression was assessed between the two groups of normal samples and
between the normal and disease samples. Differential expression was
determined via fold change and then by t-test employing replicates.
Table 1 shows the number of differentially expressed genes identified
under the various conditions.
Genes differentially expressed between normal samples were false
positives. In the fold-change analysis with no replicates, the false positive rate increases dramatically if the sample analyzed was an outlier.
Using the t-test, we can estimate the noise in the data, so that less
differential expression was detected between conditions, but the false
positive rate remained the same. Figure 2 shows that correlation plots
between replicates would have revealed the outlier sample.
Conclusion
With the increased density of current microarrays, gene expression
researchers must be able to discern between true differences across
experimental and controlled samples, and those caused by random
variation. As the above data demonstrate, an experimental design
that employs replicates allows researchers to detect variation within
the assay, increases the precision of measurement when comparing
data points, and provides the ability to detect misleading and irrelevant
outliers.
References
1. Chen Y, Dougherty ER, Bittner ML (1997) Ratio-based decisions and the
quantitative analysis of cDNA microarray images. J Biomed Optics 2: 364367.
2. Newton MA, Kendziorski CM, Richmond CS, Blattner FR, Tsui KW (2001)
On differential variability of expression ratios: improving statistical inference
about gene expression changes from microarray data. Journal of Comparative Biol 8: 37-52.
3. Pan W, Lin J, Le CT (2002) How many replicates of arrays are required to
detect gene expression changes in microarray experiments? A mixture
model approach. Genome Biol 3 (5) Epublication.
4. Tibshirani R, A simple method for assessing sample sizes in microarray
experiments. www-stat.stanford.edu/~tibs/ftp/samplesize.pdf.
Illumina, Inc. • 9885 Towne Centre Drive, San Diego, CA 92121 USA • 1.800.809.4566 toll-free • 1.858.202.4566 tel • techsupport@illumina.com • illumina.com
For research use only
© 2010 Illumina, Inc. All rights reserved.
Illumina, illuminaDx, Solexa, Making Sense Out of Life, Oligator, Sentrix, GoldenGate, GoldenGate Indexing, DASL, BeadArray,
Array of Arrays, Infinium, BeadXpress, VeraCode, IntelliHyb, iSelect, CSPro, GenomeStudio, Genetic Energy, HiSeq, and HiScan are
registered trademarks or trademarks of Illumina, Inc. All other brands and names contained herein are the property of their respective
owners. Pub. No. 470-2006-006 Current as of 13 Sep 2007

