Viewing Statistics and Summarizing Data in a Table
advertisement

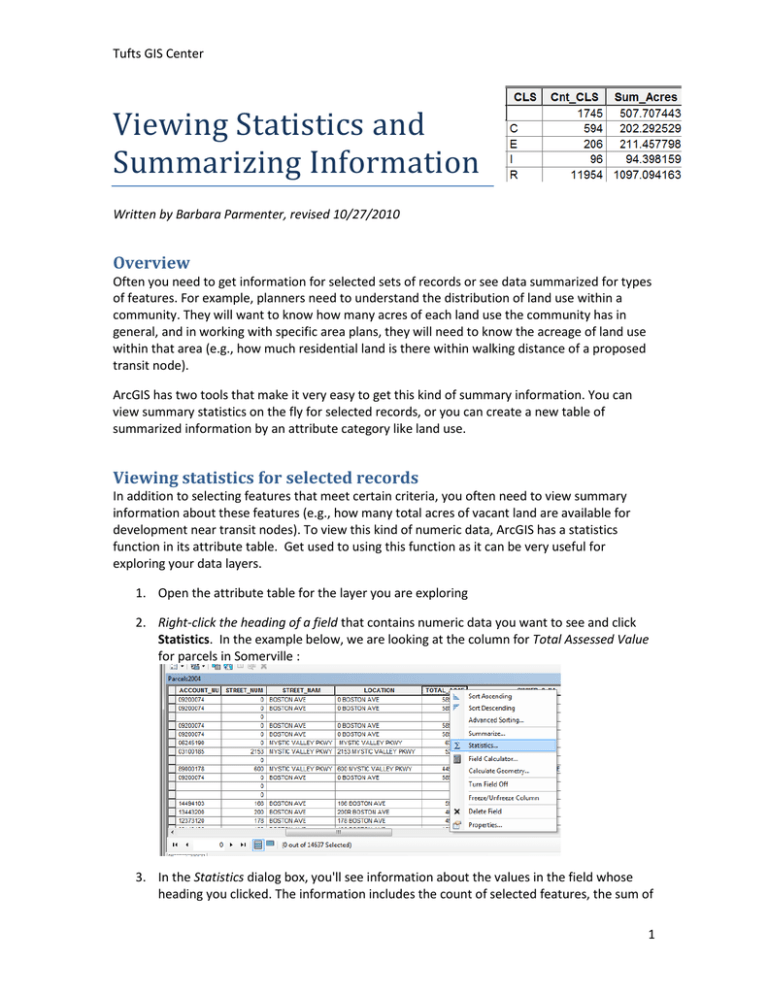
Tufts GIS Center Viewing Statistics and Summarizing Information Written by Barbara Parmenter, revised 10/27/2010 Overview Often you need to get information for selected sets of records or see data summarized for types of features. For example, planners need to understand the distribution of land use within a community. They will want to know how many acres of each land use the community has in general, and in working with specific area plans, they will need to know the acreage of land use within that area (e.g., how much residential land is there within walking distance of a proposed transit node). ArcGIS has two tools that make it very easy to get this kind of summary information. You can view summary statistics on the fly for selected records, or you can create a new table of summarized information by an attribute category like land use. Viewing statistics for selected records In addition to selecting features that meet certain criteria, you often need to view summary information about these features (e.g., how many total acres of vacant land are available for development near transit nodes). To view this kind of numeric data, ArcGIS has a statistics function in its attribute table. Get used to using this function as it can be very useful for exploring your data layers. 1. Open the attribute table for the layer you are exploring 2. Right-click the heading of a field that contains numeric data you want to see and click Statistics. In the example below, we are looking at the column for Total Assessed Value for parcels in Somerville : 3. In the Statistics dialog box, you'll see information about the values in the field whose heading you clicked. The information includes the count of selected features, the sum of 1 Tufts GIS Center the numeric value, as well as the mean, minimum, maximum, and standard deviation, plus a histogram (frequency chart) showing the distribution of values. Here are the results for Somerville parcels so you can see that in 2004, the GIS data set records 14,637 total parcels, for a sum of $7,091,188,500 of total assessed property value, with the highest assessed value for a single parcel being $41,667,500: 4. If you want to see statistics for another numeric field, click the Field drop-down arrow and click the field's name. 5. Let’s say we now want to see the total assessed value for just residential parcels in Somerville – we would first select residential parcels using the Select by Attribute function, then use the Statistics function as shown below – you see that at the bottom of the table, it says that 12,143 parcels have been selected – now when we use the Statistics function it is reporting for just those selected parcels: 2 Tufts GIS Center 6. The results look like this: 7. X out of the Statistics dialog box when you are finished exploring statistics. See a full description of how to use this tool on the online ArcGIS 10 Help - Viewing Statistics for a Table Creating a summary table of aggregated information by an attribute category class This tool works very well for summarizing numeric information by a category type value in an attribute field, for example, calculating the total acreage and assessed value of parcels by land use category within walking distance of a transit station (e.g., knowing how many acres of residential, commercial, industrial, and civic land, and the total valuation within each of those categories). This is important to understand! Generally you would ONLY summarize on a category type of attribute column, NOT on a column containing numeric data. See the example below. Note you can create a summary table for all the records in a layer (e.g., all parcels in a community) or just the selected records (parcels within walking distance of a transit station). Instructions can be found in the ArcGIS 10 online help for Summarizing Data in a Table. In this example, we will create a summary table of information about parcels within ¼ mile of a T station in Somerville, MA. We have a layer of parcel polygons with assessor attributes, and MBTA stations (you can download these from MassGIS here: http://www.mass.gov/mgis/mbta.htm). The parcel layer includes an attribute field called CLS, which indicates R for residential, C for commercial, I for industrial, E for exempt (public or other civic institution that is exempt from property taxes), and some blank values (unknown). This is what we mean by a “category” type of attribute value. We want to know, within the ¼ mile buffer, how many acres of each land use there are, and what the total valuation of property is, as well as the valuation of land and structure value. Thus we are summarizing numeric information by category type of land use. 3 Tufts GIS Center 1. We first use the Select by Location function to select parcels that are within .25 miles of a T station: 2. The results look like this: 3. Next, open the attribute table for the parcels layer. 4 Tufts GIS Center 4. Right click on the CLS field name and choose Summarize 5. Make sure you check mark Summarize on the selected records only (in this case we don’t want information for all of Somerville) 6. Expand the attribute field for any field you want to summarize. In our case we want to summarize information for total assessed value (TOTAL_ASSE), and for Land Value and Building Value, as demonstrated in the graphics below: 5 Tufts GIS Center 7. Scroll down and find LAND_VAL and choose Sum and then the same for BLDG_VAL. 8. Specify the output table by navigating to an appropriate folder and giving the table an appropriate name (e.g., Land Use Acreage and Valuation near Transit Stops.dbf) – don’t use the default name of sum_output.dbf! You will lose track of what you are doing. Also, be sure to choose dBASE table for Save as Type if you are using Shape files – see the graphic below: 9. Add the new table to ArcMap 6 Tufts GIS Center 10. To view the table, make sure that on the Table of Contents frame, you are on the Source tab of the frame, and you should see your table – right click on it and choose Open 11. Your new table summarizes the information you requested: Note that by default a COUNT is always included in the summary table so you don’t have to specify that when you are creating the table – in the example above, we see there are 102 commercial parcels near transit stops in Somerville, and a total assessed value for those commercial parcels of $154,046,000. Also note that calculating the average, minimum, and maximum values is often helpful. In this case it would help you to see the range of values in each land use category, and knowing the average value would help you compare valuation against a similar summary table calculated for all Somerville parcels OUTSIDE the transit buffer. Warning! The Summarize function is good for summarizing Numeric data by Category. It is not good for summarizing numeric data by other numeric data – e.g., don’t summarize by a population attribute in a census block – it doesn’t make sense. Always begin your Summarize task by right-clicking on an attribute field that contains category type data! 7


