To fully illustrate the transfer of energy back and forth from a
advertisement
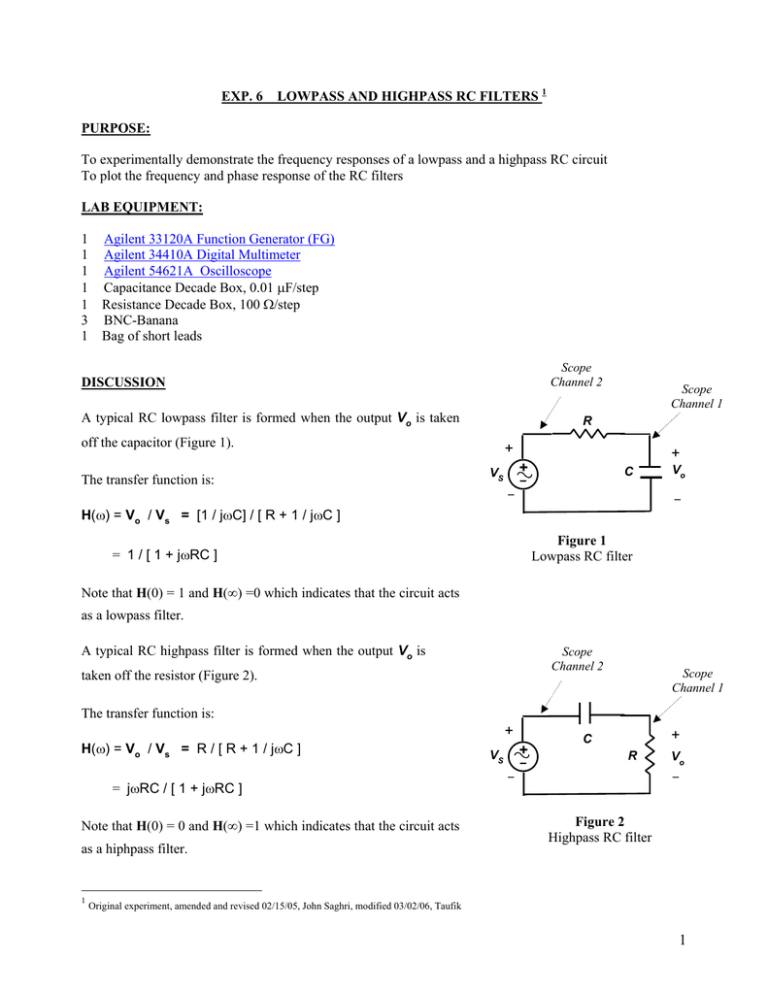
EXP. 6 LOWPASS AND HIGHPASS RC FILTERS 1 PURPOSE: To experimentally demonstrate the frequency responses of a lowpass and a highpass RC circuit To plot the frequency and phase response of the RC filters LAB EQUIPMENT: 1 1 1 1 1 3 1 Agilent 33120A Function Generator (FG) Agilent 34410A Digital Multimeter Agilent 54621A Oscilloscope Capacitance Decade Box, 0.01 µF/step Resistance Decade Box, 100 Ω/step BNC-Banana Bag of short leads Scope Channel 2 DISCUSSION A typical RC lowpass filter is formed when the output Vo is taken R off the capacitor (Figure 1). The transfer function is: Scope Channel 1 + + + - VS C - Vo - H(ω) = Vo / Vs = [1 / jωC] / [ R + 1 / jωC ] Figure 1 Lowpass RC filter = 1 / [ 1 + jωRC ] Note that H(0) = 1 and H(∞) =0 which indicates that the circuit acts as a lowpass filter. A typical RC highpass filter is formed when the output Vo is Scope Channel 2 taken off the resistor (Figure 2). Scope Channel 1 The transfer function is: + H(ω) = Vo / Vs = R / [ R + 1 / jωC ] = jωRC / [ 1 + jωRC ] Note that H(0) = 0 and H(∞) =1 which indicates that the circuit acts as a hiphpass filter. 1 + - VS + C R - Vo Figure 2 Highpass RC filter Original experiment, amended and revised 02/15/05, John Saghri, modified 03/02/06, Taufik 1 PRELAB 1. For the lowpass RC filter, calculate the phase and magnitude of the transfer function at frequencies of 20, 50, 100, 200, 500, 1000, and 1500 Hz. Tabulate the result and then sketch the magnitude and the phase of the response as function of the frequency (use log scale for frequency). Use R=50 kΩ, C=0.02 µF 2. Determine the half power frequency fc defined as the frequency at which the magnitude of the transfer function is at 1/√2 of its maximum value. Assuming C is fixed at 0.02 µF, calculate the half power frequencies corresponding to R=20 kΩ, 50 kΩ, and 100 kΩ. 3. Repeat steps above for the highpass filter. PROCEDURE Section 1. Measurement of the magnitude and phase response of RC lowpass and highpass filters 1. Set up the circuit shown in Figure 1 with C= 0.02 µF. For the value of resistor R use 20 KΩ, 50 KΩ, and 100 KΩ. Set the function generator at high-Z output termination and adjust it to provide a 2 Vpp sinusoidal waveform 2. For each value of R, construct a table as shown below. Enter the measured rms values of Vs and Vo , and the phase difference between Vo and Vs, while setting the frequency of the function generator to the values shown in the table below. f (Hz) Log10 (f) Vs (Vrms) Vo (Vrms) Vo/ Vs ∠ Vo/ Vs (degrees) 5 25 50 250 500 2500 5000 25000 2 3. Plot the magnitude and phase of the transfer function as a function of the frequency for each value of R using the tables you generated in step 2. Use log scale for frequency and plot the three magnitude responses on one graph and the three phase responses on another. 4. Obtain the half power frequencies directly from your magnitude plots for each value of the resistor used. Enter your results in the table below Table 1. Calculated and measured half power frequencies for the RC lowpass filter fc (calculated) fc (measured) Percent difference R= 20 kΩ C= 0.02 µF R= 50 kΩ C= 0.02 µF R= 100 kΩ C= 0.02 µF 5. Repeat steps 1 through 4 except use the highpass filter of Figure 2. Table 2. Calculated and measured half power frequencies for the RC Highpass filter fc (calculated) fc (measured) Percent difference R= 20 kΩ C= 0.02 µF R= 50 kΩ C= 0.02 µF R=100 kΩ C= 0.02 µF QUESTIONS 1. How well do the calculated magnitude and the phase plots in your prelab compare with the corresponding plots obtained via experimental measurements? Explain the reasons for the difference. 2. Explain the reasons or percent differences between the calculated and measured values of the half power frequencies. 3. Why is fccalled ‘half power’ frequency? Section 2. PSPICE simulation of the magnitude response of RC lowpass and highpass filters 3 Use PSPICE to obtain the plot of the magnitude response of the transfer function for the lowpass and highpass filters. For simplicity, use R=50 kΩ and C = 0.02 µF. For your source, choose ‘VAC’ for the source from the PSPICE ‘SOURCE’ library. Use the default voltage setting of 1 VP. Edit 50 0.02 µF the ‘Simulation Settings’ menu as shown below. Include the hardcopy of the magnitude response for both the lowpass and the highpass RC filters in your report. The plots should be well annotated. 5hz 25000hz 4
