bayes classifier in multidimensional data classification
advertisement
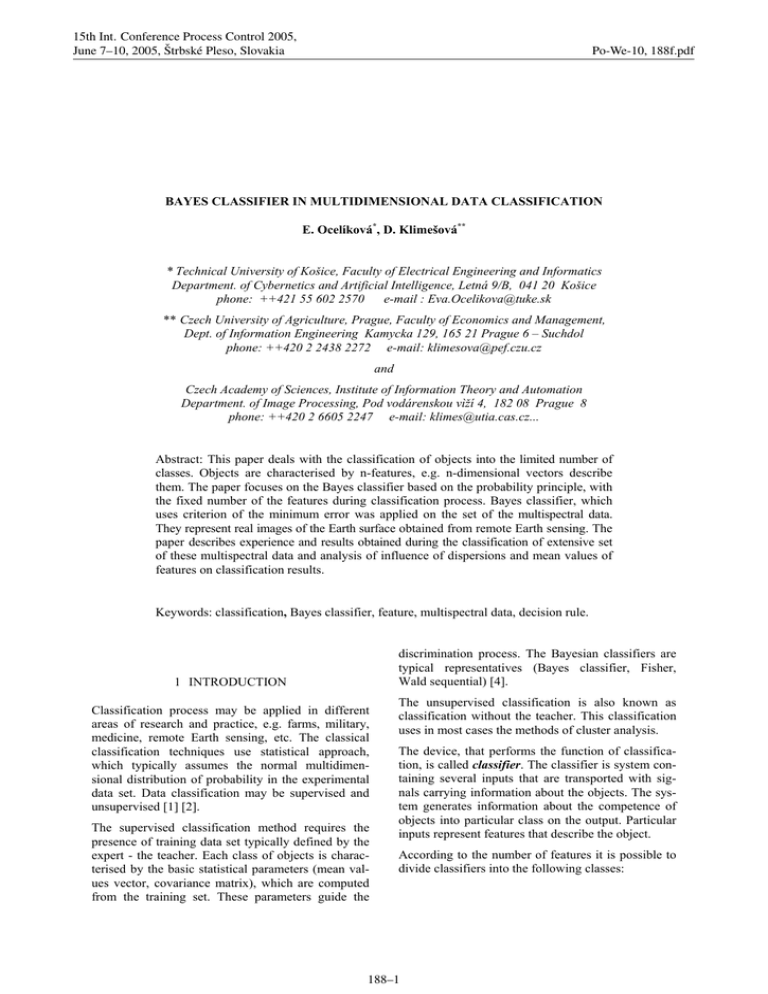
15th Int. Conference Process Control 2005, June 7–10, 2005, Štrbské Pleso, Slovakia Po-We-10, 188f.pdf BAYES CLASSIFIER IN MULTIDIMENSIONAL DATA CLASSIFICATION E. Ocelíková*, D. Klimešová** * Technical University of Košice, Faculty of Electrical Engineering and Informatics Department. of Cybernetics and Artificial Intelligence, Letná 9/B, 041 20 Košice phone: ++421 55 602 2570 e-mail : Eva.Ocelikova@tuke.sk ** Czech University of Agriculture, Prague, Faculty of Economics and Management, Dept. of Information Engineering Kamycka 129, 165 21 Prague 6 – Suchdol phone: ++420 2 2438 2272 e-mail: klimesova@pef.czu.cz and Czech Academy of Sciences, Institute of Information Theory and Automation Department. of Image Processing, Pod vodárenskou vìží 4, 182 08 Prague 8 phone: ++420 2 6605 2247 e-mail: klimes@utia.cas.cz... Abstract: This paper deals with the classification of objects into the limited number of classes. Objects are characterised by n-features, e.g. n-dimensional vectors describe them. The paper focuses on the Bayes classifier based on the probability principle, with the fixed number of the features during classification process. Bayes classifier, which uses criterion of the minimum error was applied on the set of the multispectral data. They represent real images of the Earth surface obtained from remote Earth sensing. The paper describes experience and results obtained during the classification of extensive set of these multispectral data and analysis of influence of dispersions and mean values of features on classification results. Keywords: classification, Bayes classifier, feature, multispectral data, decision rule. discrimination process. The Bayesian classifiers are typical representatives (Bayes classifier, Fisher, Wald sequential) [4]. 1 INTRODUCTION Classification process may be applied in different areas of research and practice, e.g. farms, military, medicine, remote Earth sensing, etc. The classical classification techniques use statistical approach, which typically assumes the normal multidimensional distribution of probability in the experimental data set. Data classification may be supervised and unsupervised [1] [2]. The supervised classification method requires the presence of training data set typically defined by the expert - the teacher. Each class of objects is characterised by the basic statistical parameters (mean values vector, covariance matrix), which are computed from the training set. These parameters guide the The unsupervised classification is also known as classification without the teacher. This classification uses in most cases the methods of cluster analysis. The device, that performs the function of classification, is called classifier. The classifier is system containing several inputs that are transported with signals carrying information about the objects. The system generates information about the competence of objects into particular class on the output. Particular inputs represent features that describe the object. According to the number of features it is possible to divide classifiers into the following classes: 188–1 15th Int. Conference Process Control 2005, June 7–10, 2005, Štrbské Pleso, Slovakia 1. 2. Po-We-10, 188f.pdf The classifiers with variable number of features, so-called sequential classifiers. This one starts process of classification with valuation of the one feature and if the process is decidable, classification is ended. In inverse case the next feature is added and the process repeats while the process of classification is undecided. The classifiers with fixed number of features. These are characteristic with the exact number of features. This number is fixed during the whole classification process. λ (ω r | ω s ) = 0 λ (ω r | ω s ) = 1 In the following we will look at Bayes classifier. 2 BAYES CLASSIFIER As mentioned Bayes classifier is the classifier with fixed number of the features. The classified patterns x are described by n-features If the diagonal loss function is selected within the form R if r=s λ (ω r | ω s ) = 0 if r≠s (4) If the patterns x from miscellaneous classes are like statistical set, they can be approximated by normal distribution. The conditional probability density function has the form p (x | ω ) = x = [ x1 , x 2 ,..., x n ] and by pattern space which con- J =∑ λ (ω r | ω s ) = − hi where h i > 0 , then discriminate function is g r (x ) = − hs p(x | ω s )P(ω s ) . In this case the loss function states negative loss to a correct decision and no loss to an incorrect decision. The choice of constants hi is intuitive. T tains R disjunctive subsets Qr, r = 1, ..., R . Bayes classifier uses criterion of the minimum error (3) discriminate function is g r (x ) = p(x | ω s )P(ω s ) . This loss function states that we lose one unit for only misrecognition and nothing is lost for correct classification. According to the other aspects it is possible to divide classification systems into simple and complex, parametric and nonparametric, etc. This paper mentions problems (as similarity and large dispersion of particular classes), which are possible to arise at the classification by Bayes classifier. r=s r≠s if if 1 2π R/2 1 exp − (x − µ )T W −1 (x − µ ) 2 |W | (5) where |W| is determinant of covariance matrix. Covariance matrix W is R ∫ ∑ λ (d B (x ) | ω s )p(x | ω s )P(ω s )dx (1), W = r =1 Qr s =1 where λ (d B (x ) | ω s ) is the loss function and d B (x ) is optimal Bayes decision rule which minimises average loss (1). The valuation of criterion in this form is difficult therefore it is transformed to more easily form R L x (ω r ) = ∑ λ (ω r | ω s )p(x | ω s )P(ω s ) . (2) s =1 The equation (2) represents the loss that will be after the classification of pattern x into the class ω r , if the pattern does not belong to this class. The optimal decision rule is L x (d B (x )) = min L x (ω r ) . It is possible to realize on the principle discriminate functions [7]. The form of discriminate function depends on the choice of the loss functions. ( )( ) T 1 K ( xi − µ xi − µ , ∑ K i =1 (6) where K is number of patterns in the class and µ is the mean vector µ= 1 K ∑ xi . K i =1 (7) If g s ( x ) > g r ( x ) is true then pattern x is nearest to the class ω s . If there are noises in the input set then classical Bayes classifier assigns this pattern (noise) to the nearest cluster. Augmented Bayes classifier allows solving this problem. This augmented classifier tests Mahalanobis distance DM by chi-quadrate distribution χ α2 (n) with number of features n and with significance level α . Mahalanobis distance becomes for class ω r ,where r=1, 2, …, R If the symmetric loss function is selected within the form 188–2 2 DMr = (x − µ r )T W −1 (x − µ r ) . (8) 15th Int. Conference Process Control 2005, June 7–10, 2005, Štrbské Pleso, Slovakia Po-We-10, 188f.pdf On the base of test the result of classification is: 1. 2 If D Mr ≤ χ α2 (n ) class ω r . then x this, (see Figure 1 and Figure 2). The best results were obtained in 2nd and 6th classes with 97% successful classification. belongs to 2 D Mr > χ α2 (n ) then x belongs to class T0 , where T0 is "other" class. 2. If The results of classification were similar when significance level α = 0,01, (see contingent Table 2). Correct classification increased by the choice of significance level α = 0,01 about 2% in 5th class, about 3% in 3rd and 4th classes. The best results were obtained in 6th class with 100% successful classification. In this class a little dispersion of the patterns was observed. 3 CLASSIFICATION OF IMAGE OF EARTH SURFACE The testing of augmented Bayes classifier was applied on training set of image data obtained from remote Earth sensing. Data source contained 800 patterns. The patterns had multispectral character and seven dimensional vectors represented them. The patterns were divided into 8 classes: 1. stubble 2. grass 3. asphalt 4.concrete 5. roof 6. water 7. shadow 8. tree. Explanation of symbols (Table 1 and Table 2) 9 - the class “other“ N1 - the number of patterns of the original classes N1% - the number of correctly classified patterns in percentage E1% - error of the first kind in percentage; it means error which arises after the assignment of patterns from certain original class to another classes after classification Contingent tables Table 1 and Table 2 show the evaluation of obtained classification results. - the number of patterns classified into certain class after classification N2 Symmetric loss function was used for realization of the tests. The tests were made with the significance level α = 0,05 and α = 0,01. Contingent Table 1. contains the results of the classification with significance level α = 0,05. Less satisfactory results were obtained in 4th and 5th classes. Similarity of mean values and large dispersions of the patterns involve E2% - error of the second kind in percentage; it means error which arises after the assignment of patterns from all original classes into one certain class after classification. Table 1. Contingent table - results of Bayes classification with α = 0,05 Original classes 1 2 3 4 5 6 7 8 N2 E2% Classes after the classification 1 95 0 0 0 0 0 0 0 95 0 2 5 97 0 0 1 0 0 0 103 6 3 0 2 95 5 0 0 0 0 102 7 4 0 0 0 85 13 0 0 0 98 14 5 0 0 2 6 80 0 3 0 91 13 6 0 0 0 0 0 97 0 0 97 0 188–3 7 0 0 0 0 3 0 90 8 101 11 8 0 0 0 0 0 0 5 92 97 6 9 0 1 3 4 3 3 2 0 16 N1 N1% E1% 100 99 97 96 97 97 98 100 784 95 97 97 88 82 100 91 92 5 3 3 12 18 0 9 8 15th Int. Conference Process Control 2005, June 7–10, 2005, Štrbské Pleso, Slovakia Po-We-10, 188f.pdf Table 2. Contingent table- results of Bayes classification with α = 0,01 Original classes Classes after the classification 1 95 0 0 0 0 0 0 0 95 0 1 2 3 4 5 6 7 8 N2 E2% 2 5 98 0 0 1 0 0 0 104 6 3 0 2 98 5 0 0 0 0 105 7 4 0 0 0 88 13 0 0 0 101 13 5 0 0 2 6 82 0 3 0 93 12 6 0 0 0 0 0 100 0 0 100 0 7 0 0 0 0 3 0 91 8 102 11 8 0 0 0 0 0 0 6 92 98 7 9 0 0 0 1 1 0 0 0 2 N1 N 1% E1% 100 100 100 99 99 100 100 100 798 95 98 98 88 82 100 91 92 5 2 2 12 18 0 9 8 CONCLUSION 1 600 1 400 dispersion 1 200 1 000 800 1. feature 600 2. feature 400 3. feature 200 0 1. 2. 3. 4. 5. 6. 7. 8. class Fig. 1. Dispersions of features in the classes ACKNOWLEDGMENT 250 200 mean value Bayes classifier absolutely successfully recognized the patterns from the class in which dispersion of the patterns was small (6th class). The data from all classes were classified overall successfully except the 4th and 5th classes. These classes were classified less successfully because they had large dispersions and very similar mean values of features. The advantage of Bayes classifier its classification rate because it always calculates R discriminate equations only in the decision process (R is the number of classes). For successful usage of Bayes classifier, a priori information about number of patterns, multiplicity of patterns in the various classes, mean values of features are necessary and the condition of semi definition covariance matrix must be valid. Bayes classifier in the case did not classify the data when some of the mentioned conditions were absent. 150 1. feature 100 2. feature The work has been supported by the grant agency VEGA project No. 1/2185/05 and project SR-CzR No. 008. This support is very gratefully acknowledgement. 3. feature 50 0 6 REFERENCES 1. 2. 3. 4. 5. 6. 7. 8. class Devijaver, P. E., Kittler, J. (1982). Pattern recognition: a statistical approach. Prentice-Hall, Inc., London. Fig. 2. Mean values of features in the classes Fukunaga, K. (1972). Introduction to statistical pattern recognition. Academic Press, New York. 188–4 15th Int. Conference Process Control 2005, June 7–10, 2005, Štrbské Pleso, Slovakia Po-We-10, 188f.pdf Ocelíková, E., Klimešová,, D. (2004). Contribution to the Classification of Multidimensional Data. In: Proceedings of 2nd Slovakian-Hungarian Joint Symposium on Applied Machine Intelligence, SAMI 2004, Herľany, Slovakia, January 16-17, pp. 71-76. Kharin Yu. S. (1997). Statistical techniques: Optimality and robustness, 1st International Workshop on STRIP ‘97, Prague, June, pp. 135-140. Landryová, L., Gondek, H. and Fecko, P. (2004). Research for Mining Optimization and Biogas Utilization with Minimizing its Escape into the Atmosphere In: 21st Annual International Coal Energy and the Environment Pittsburgh Coal Conference. Osaka, Japan, International Convention Centre, pp. 6, poster 12/2. Ocelíková, E., Zolotová, I., Landryová, L. (2003). Risk Classes and Cluster Analysis. Sborník vìdeckých prací VŠB-TU Ostrava, r. XLIX, è. 1, èást 2, øada strojní, s. 17-20. Leondes, C. T. (1998). Image Processing and Pattern Recognition.. Academic Press, New York. Ocelíková, E., Zolotová, I., Klimešová, D.. (2002): Multikriteriálna klasifikácia zdravotného stavu.. Lékař a technika, ročník 33, No. 6, pp.187-191. Ocelíková, E., Madarász, L. (2002). Contribution to Creation of Macrosituations of Complex System. Journal of Advanced Computional Intelligence, Vol. 6, No.2, pp. 79-83. Raudys, S. (1997). Intrinsic Dimensionality and Small Sample Properties of Statistical Classifier. 1st International Workshop on STRIP ‘97, Prague, June, pp. 85-90. Ocelíková, E., Krištof, J. (2000). Statistical Classification Techniques In: Proc. of the 34th Spring International Conference "Modelling and Simulation of Systems MOSIS", May 2-4, Rožnov pod Radhoštem, pp. 111-116. Wilson, d. R., Martinez, T. R. (1997). Improved Heterogeneous Distance Functions. Journal of Artificial Intelligence Research, No. 6, pp. 1-34. 188–5
