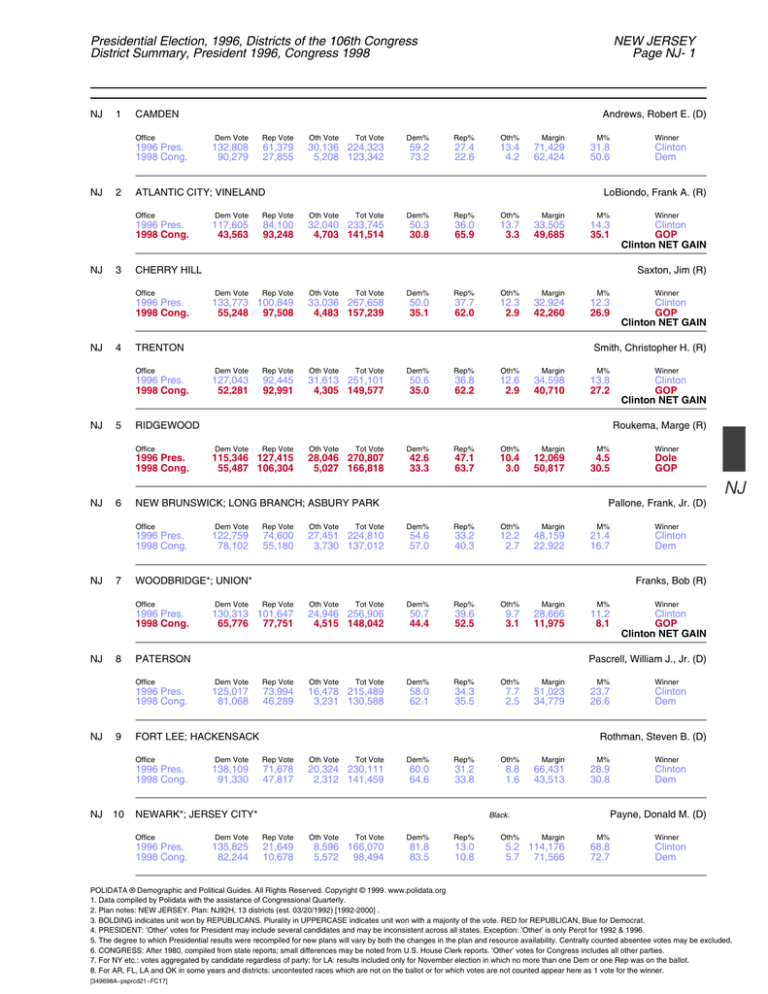
Presidential Election, 1996, Districts of the 106th Congress
District Summary, President 1996, Congress 1998
NJ
1
CAMDEN
Office
1996 Pres.
1998 Cong.
NJ
2
1996 Pres.
1998 Cong.
3
1996 Pres.
1998 Cong.
4
1996 Pres.
1998 Cong.
5
1996 Pres.
1998 Cong.
6
1996 Pres.
1998 Cong.
7
1996 Pres.
1998 Cong.
8
1996 Pres.
1998 Cong.
9
1996 Pres.
1998 Cong.
10
59.2
73.2
Rep%
27.4
22.6
Oth%
13.4
4.2
Margin
71,429
62,424
Dem Vote
117,605
43,563
Rep Vote
84,100
93,248
M%
31.8
50.6
Oth Vote
Tot Vote
32,040 233,745
4,703 141,514
Dem%
50.3
30.8
Rep%
36.0
65.9
Oth%
13.7
3.3
Margin
33,505
49,685
M%
14.3
35.1
1996 Pres.
1998 Cong.
Winner
Clinton
GOP
Clinton NET GAIN
Saxton, Jim (R)
Dem Vote
Rep Vote
133,773 100,849
55,248 97,508
Oth Vote
Tot Vote
33,036 267,658
4,483 157,239
Dem%
50.0
35.1
Rep%
37.7
62.0
Oth%
12.3
2.9
Margin
32,924
42,260
M%
12.3
26.9
Winner
Clinton
GOP
Clinton NET GAIN
Smith, Christopher H. (R)
Dem Vote
127,043
52,281
Rep Vote
92,445
92,991
Oth Vote
Tot Vote
31,613 251,101
4,305 149,577
Dem%
50.6
35.0
Rep%
36.8
62.2
Oth%
12.6
2.9
Margin
34,598
40,710
M%
13.8
27.2
Winner
Clinton
GOP
Clinton NET GAIN
Roukema, Marge (R)
Dem Vote
Rep Vote
115,346 127,415
55,487 106,304
Oth Vote
Tot Vote
28,046 270,807
5,027 166,818
Dem%
42.6
33.3
Rep%
47.1
63.7
Oth%
10.4
3.0
Margin
12,069
50,817
Dem Vote
122,759
78,102
Rep Vote
74,600
55,180
Oth Vote
Tot Vote
27,451 224,810
3,730 137,012
M%
4.5
30.5
Dem Vote
Winner
Dole
GOP
Pallone, Frank, Jr. (D)
Dem%
54.6
57.0
Rep%
33.2
40.3
Oth%
12.2
2.7
Margin
48,159
22,922
M%
21.4
16.7
NJ
Winner
Clinton
Dem
Franks, Bob (R)
Rep Vote
130,313 101,647
65,776 77,751
Oth Vote
Tot Vote
24,946 256,906
4,515 148,042
Dem%
50.7
44.4
Rep%
39.6
52.5
Oth%
9.7
3.1
Margin
28,666
11,975
M%
11.2
8.1
Winner
Clinton
GOP
Clinton NET GAIN
Pascrell, William J., Jr. (D)
Dem Vote
125,017
81,068
Rep Vote
73,994
46,289
Oth Vote
Tot Vote
16,478 215,489
3,231 130,588
Dem%
58.0
62.1
Rep%
34.3
35.5
Oth%
7.7
2.5
Margin
51,023
34,779
Dem Vote
138,109
91,330
Dem Vote
135,825
82,244
M%
23.7
26.6
Winner
Clinton
Dem
Rothman, Steven B. (D)
Rep Vote
71,678
47,817
Oth Vote
Tot Vote
20,324 230,111
2,312 141,459
Dem%
60.0
64.6
Rep%
31.2
33.8
NEWARK*; JERSEY CITY*
Office
Winner
Clinton
Dem
LoBiondo, Frank A. (R)
FORT LEE; HACKENSACK
Office
NJ
Dem%
PATERSON
Office
NJ
Tot Vote
WOODBRIDGE*; UNION*
Office
NJ
Oth Vote
30,136 224,323
5,208 123,342
NEW BRUNSWICK; LONG BRANCH; ASBURY PARK
Office
NJ
61,379
27,855
RIDGEWOOD
Office
NJ
Rep Vote
TRENTON
Office
NJ
Dem Vote
132,808
90,279
CHERRY HILL
Office
NJ
Andrews, Robert E. (D)
ATLANTIC CITY; VINELAND
Office
NJ
NEW JERSEY
Page NJ- 1
Oth%
8.8
1.6
Margin
66,431
43,513
M%
28.9
30.8
Payne, Donald M. (D)
Black.
Rep Vote
21,649
10,678
Oth Vote
Tot Vote
8,596 166,070
5,572 98,494
Dem%
81.8
83.5
Rep%
13.0
10.8
Oth%
Winner
Clinton
Dem
Margin
5.2 114,176
5.7 71,566
M%
68.8
72.7
Winner
Clinton
Dem
POLIDATA ® Demographic and Political Guides. All Rights Reserved. Copyright © 1999. www.polidata.org
1. Data compiled by Polidata with the assistance of Congressional Quarterly.
2. Plan notes: NEW JERSEY. Plan: NJ92H, 13 districts (est. 03/20/1992) [1992-2000] .
3. BOLDING indicates unit won by REPUBLICANS. Plurality in UPPERCASE indicates unit won with a majority of the vote. RED for REPUBLICAN, Blue for Democrat.
4. PRESIDENT: ’Other’ votes for President may include several candidates and may be inconsistent across all states. Exception: ’Other’ is only Perot for 1992 & 1996.
5. The degree to which Presidential results were recompiled for new plans will vary by both the changes in the plan and resource availability. Centrally counted absentee votes may be excluded.
6. CONGRESS: After 1980, compiled from state reports; small differences may be noted from U.S. House Clerk reports. ’Other’ votes for Congress includes all other parties.
7. For NY etc.: votes aggregated by candidate regardless of party; for LA: results included only for November election in which no more than one Dem or one Rep was on the ballot.
8. For AR, FL, LA and OK in some years and districts: uncontested races which are not on the ballot or for which votes are not counted appear here as 1 vote for the winner.
[349698A~psprcd21~FC17]
NEW JERSEY
Page NJ- 2
NJ
11
MORRIS CO.
Office
1996 Pres.
1998 Cong.
NJ
12
1996 Pres.
1998 Cong.
13
Frelinghuysen, Rodney P. (R)
Dem Vote
Rep Vote
116,466 136,025
44,160 100,910
Oth Vote
Tot Vote
26,428 278,919
3,901 148,971
Dem%
41.8
29.6
Rep%
48.8
67.7
FLEMINGTON; PRINCETON
Office
NJ
Presidential Election, 1996, Districts of the 106th Congress
District Summary, President 1996, Congress 1998
Dem Vote
Rep Vote
140,033 121,837
92,528 87,221
1996 Pres.
1998 Cong.
Dem Vote
117,241
70,308
Rep Vote
35,482
14,615
9.5
2.6
Margin
19,559
56,750
M%
7.0
38.1
Oth Vote
Tot Vote
29,999 291,869
4,861 184,610
Dem%
48.0
50.1
Rep%
41.7
47.3
Oth Vote
Oth%
10.3
2.6
Margin
18,196
5,307
Tot Vote
Dem%
71.5
80.1
Rep%
21.6
16.6
Oth%
6.9
3.3
M%
6.2
2.9
Winner
Clinton
Dem
Menendez, Robert (D)
Hispanic.
11,336 164,059
2,900 87,823
Winner
Dole
GOP
Holt, Rush (D)
Freshman.
NEWARK*; JERSEY CITY*; ELIZABETH
Office
Oth%
Margin
81,759
55,693
M%
49.8
63.4
Winner
Clinton
Dem
NJ
POLIDATA ® Demographic and Political Guides. All Rights Reserved. Copyright © 1999. www.polidata.org
1. Data compiled by Polidata with the assistance of Congressional Quarterly.
2. Plan notes: NEW JERSEY. Plan: NJ92H, 13 districts (est. 03/20/1992) [1992-2000] .
3. BOLDING indicates unit won by REPUBLICANS. Plurality in UPPERCASE indicates unit won with a majority of the vote. RED for REPUBLICAN, Blue for Democrat.
4. PRESIDENT: ’Other’ votes for President may include several candidates and may be inconsistent across all states. Exception: ’Other’ is only Perot for 1992 & 1996.
5. The degree to which Presidential results were recompiled for new plans will vary by both the changes in the plan and resource availability. Centrally counted absentee votes may be excluded.
6. CONGRESS: After 1980, compiled from state reports; small differences may be noted from U.S. House Clerk reports. ’Other’ votes for Congress includes all other parties.
7. For NY etc.: votes aggregated by candidate regardless of party; for LA: results included only for November election in which no more than one Dem or one Rep was on the ballot.
8. For AR, FL, LA and OK in some years and districts: uncontested races which are not on the ballot or for which votes are not counted appear here as 1 vote for the winner.
[349698A~psprcd21~FC17]


