Fluorescence lifetimes: time-domain or frequency domain?
advertisement

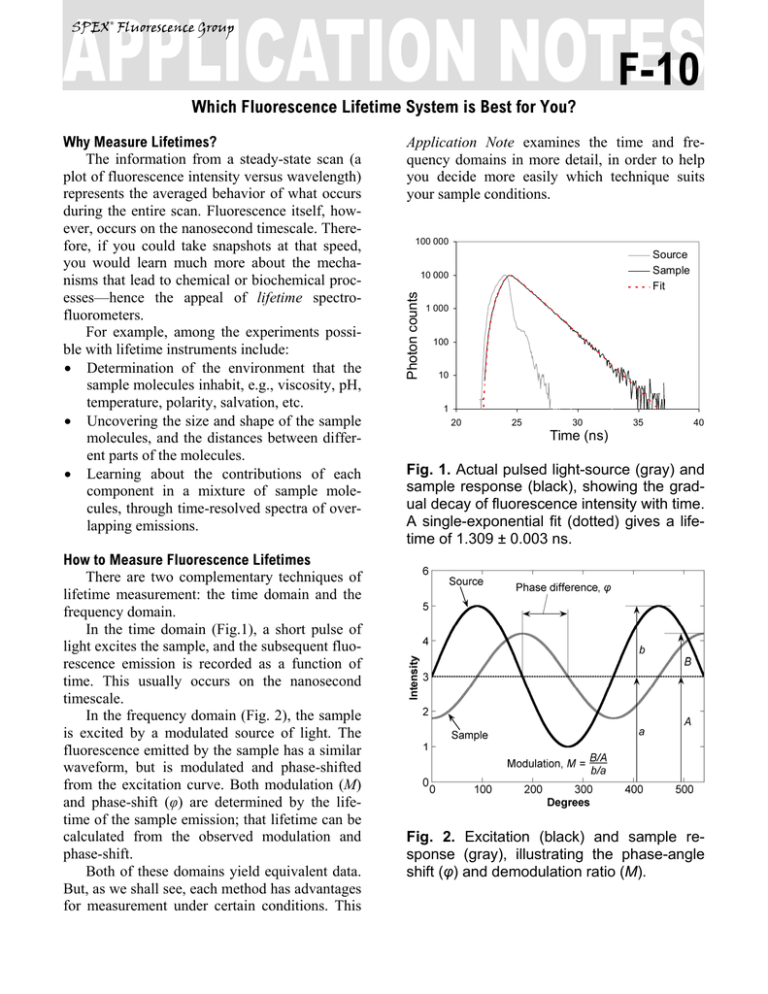
SPEX® Fluorescence Group F-10 Which Fluorescence Lifetime System is Best for You? How to Measure Fluorescence Lifetimes There are two complementary techniques of lifetime measurement: the time domain and the frequency domain. In the time domain (Fig.1), a short pulse of light excites the sample, and the subsequent fluorescence emission is recorded as a function of time. This usually occurs on the nanosecond timescale. In the frequency domain (Fig. 2), the sample is excited by a modulated source of light. The fluorescence emitted by the sample has a similar waveform, but is modulated and phase-shifted from the excitation curve. Both modulation (M) and phase-shift (φ) are determined by the lifetime of the sample emission; that lifetime can be calculated from the observed modulation and phase-shift. Both of these domains yield equivalent data. But, as we shall see, each method has advantages for measurement under certain conditions. This Application Note examines the time and frequency domains in more detail, in order to help you decide more easily which technique suits your sample conditions. 100 000 Source Sample Fit 10 000 Photon counts Why Measure Lifetimes? The information from a steady-state scan (a plot of fluorescence intensity versus wavelength) represents the averaged behavior of what occurs during the entire scan. Fluorescence itself, however, occurs on the nanosecond timescale. Therefore, if you could take snapshots at that speed, you would learn much more about the mechanisms that lead to chemical or biochemical processes—hence the appeal of lifetime spectrofluorometers. For example, among the experiments possible with lifetime instruments include: • Determination of the environment that the sample molecules inhabit, e.g., viscosity, pH, temperature, polarity, salvation, etc. • Uncovering the size and shape of the sample molecules, and the distances between different parts of the molecules. • Learning about the contributions of each component in a mixture of sample molecules, through time-resolved spectra of overlapping emissions. 1 000 100 10 1 20 25 30 35 40 Time (ns) Fig. 1. Actual pulsed light-source (gray) and sample response (black), showing the gradual decay of fluorescence intensity with time. A single-exponential fit (dotted) gives a lifetime of 1.309 ± 0.003 ns. Fig. 2. Excitation (black) and sample response (gray), illustrating the phase-angle shift (φ) and demodulation ratio (M). Monochromator Detector Sample Source Fluorescence Decay Law Both the time- and frequency-domain methods take advantage of the fluorescence decay law, which is based on first-order kinetics. The decay law postulates that if a population of molecules is instantaneously excited when photons are absorbed, then the excited population—and hence the fluorescence intensity as a function of time, I(t)—gradually decays to the ground state. Decay kinetics can be described by statistical single-photon events Sample chamber −t I (t ) = α e τ Time Domain Time-domain measurements are based on the assumption that, when photons are absorbed, the molecules can be excited in an infinitely brief moment. This idea is commonly known as the delta or δ-pulse. The δ-pulse idea is used to interpret data obtained with real pulsed lightsources with measurable pulse-widths. In practice, the time-dependent profile of the light-pulse is reconvolved with the decay-law function. Reconvolution assumes that the δ-pulses are continuous functions, so that the observed decay is the convolution integral of the decays from all δpulses initiated during the finite pulse-width3. periodic pulses CFD SYNC STOP START power MCA α ≤ 2% TAC Controller PHOTON COUNTS 12000 10000 8000 6000 Cumulative histogram 4000 2000 0 36 35 34 33 32 31 30 29 28 27 26 25 24 23 22 21 20 19 18 17 16 15 14 13 12 11 10 9 8 7 6 5 4 3 2 1 where α is the intensity at time t = 0, t is the time after the absorption, and τ is the lifetime, that is, when the fraction of the population of molecules in the excited state (and the fluorescence intensity) has decreased by a factor of 1/e, or ~37%. Note that before absorption, I(t) = 0. This fluorescence decay law implies that all excited molecules exist in a homogenous environment, as is true for many single-exponential fluorescence lifetime standards in solution1,2. Apart from such standards, however, single-exponential decays are usually a real-life exception, because most populations of excited molecules do not exist in homogeneous environments, and can be influenced by various factors, including the presence of quenchers, energy-transfer processes among members of the population, and different rates of molecular rotation. Hence, in most instances, multi-exponential or non-exponential forms of the decay-law equation must be applied. TIME, CHANNELS Fig. 3. Time-Correlated Single-PhotonCounting fluorometer. A pulsed light Source excites the Sample repetitively. The sample emission is observed by a Detector, while the excitation flashes are detected by a synchronization module (SYNC). A constantfraction discriminator (CFD) responds to only the first photon detected (small arrows)—independent of its amplitude—from the detector. This first photon from sample emission is the stop signal for the Time-toAmplitude Converter (TAC). The excitation pulses trigger the start signals. The MultiChannel Analyzer (MCA) records repetitive start-stop signals of the single-photon events from the TAC, to generate a histogram of photon counts as a function of timechannel units. The lifetime is calculated from this histogram. There are many ways to record time-domain data, such as streak cameras, boxcar integrators, Frequency Domain The fluorescence decay parameters in the decay law’s impulse function may be obtained based on the relation of a sinusoidally modulated excitation beam to the fluorescence emission response (Fig. 2). The emission occurs at the same frequency as the excitation. Because of the loss of electron energy (Stokes’ shift) between excitation and emission, the emission waveform is demodulated and phase-shifted in comparison to the excitation. Thus the demodulation ratio (M) and phase-angle shift (φ) constitute two separate observable parameters that are both directly related, via a Fourier transformation4, to the initial fluorescence intensity, α, and lifetime, τ, for a population of fluorophores. Frequency-domain measurements are best performed using Multi-Frequency Cross-Correlation phase-and-modulation (MFCC), shown in Fig. 4. A modulated beam excites the sample. The fluorescence emission is detected by a PhotoMultiplier Tube (PMT) modulated at the same base radio-frequency as the master plus a low cross-correlation frequency (a few Hz). The base-frequency signals are filtered to reveal the cross-correlation frequency signal, which contains all the same demodulation (M) and phaseangle shift (φ) information as the fluorescence emission. Source Excit. Mono. Master Rf Amp 1 Pockels Rf Sample Emis. Mono. ∆f 1 Rf Slave Rf+∆f Amp 2 PMT Rf+∆f ∆f AMPLITUDE and so forth. Most agree, however, that the method of single-photon counting is, by far, superior. Time-Correlated Single-Photon Counting (TCSPC) measurements are shown in Fig. 3. TCSPC uses a pulsed light-source and a circuit to detect single-photon events at a detector. In a repetitive series of many start-stop signals from the circuitry, a binned histogram in time channels of single-photon counts is gradually generated. TCSPC relies on a principle of Poissonian statistics, that only one photon can be counted at a time and in any one channel, to avoid skewing the time-dependent statistics in photon-pile-up. Pile-up thus limits the data-acquisition rate of TCSPC to a few (typically 1–2) percent of the repetition rate. In practice, the single-photon limit is not a major hindrance because the pile-up limit can be monitored during the experiment, and decay times with sufficient photon counts in can be obtained in seconds to minutes with repetition rates in the MHz range. In addition, the Poissonian nature of the statistics allows the data to be rigorously analyzed. 0.5 φ M 0 -0.5 -1 TIME Fig. 4. Multi-Frequency Cross-Correlation fluorometer. An unmodulated light Source emits a spectrum of continuous-wave light. The excitation monochromator (Excit. Mono.) selects an excitation wavelength. An amplified (Amp 1) master synthesizer (Master) drives the Pockels cell (Pockels) at a base frequency, Rf, which modulates the excitation beam. The modulated beam excites the Sample, causing the sample to emit modulated fluorescence also at the base Rf. An emission monochromator (Emis. Mono.) selects one wavelength of modulated fluorescence. The photomultiplier tube (PMT) is modulated by an amplified (Amp 2) slave synthesizer (Slave) at the base Rf plus a low-frequency cross-correlation note (∆f). The sample emission at Rf cancels the slave Rf+∆f frequencies to yield the ∆f signal containing the same phase-angle shift (φ) and demodulation ratio (M) as the Rf fluorescence. Usually the sample is scanned over a range (10–16) of frequencies because of the intrinsic limitations of resolving mixtures using only one frequency. In theory, for a single-exponential emitter, one should observe the same lifetime using the observed φ and M at any given frequency4,5. However, for mixtures of components, φ is biased towards the faster decay components and M is weighted toward the slower components. Hence, resolving separate fluorescence lifetime parameters for mixtures requires a range of frequencies to be statistically valid. On the other hand, the MFCC technique is not constrained by the Poissonian single-photon detection limits of TCSPC. Therefore, rapid acquisition at a high signal-to-noise ratio to resolve complex mixtures is possible. Which Method is Best for Your Sample? In principle, both methods can yield identical results for a wide variety of experimental samples and conditions. A user may choose one Spex®-IBH fluorescence lifetime instrument method over the other for a variety of reasons: The frequency domain, for example, is compatible with a strong, tunable continuouswave xenon excitation source that seamlessly covers a wide spectral range. With the frequency domain, lifetimes as short as 10 picoseconds can be measured with a continuous source, tunable from the UV to the near-IR. All other conditions being equal, frequency domain is usually faster than time domain. Time-domain instruments have no continuously tunable, pulsed source from the UV to IR, so the choice of excitation wavelength is more limited. Because of pulse-width, lifetimes are usually limited to no shorter than just under a nanosecond with a flash lamp, though they can operate at picosecond timeframes with inexpensive diode sources. On the other hand, TCSPC is compatible with precise and inexpensive pulsed light-emitting diodes and diode-laser sources. The single-photon detection method is preferred In the USA: Jobin Yvon Inc. 3880 Park Avenue, Edison, NJ 08820 Tel:+1-732-494-8660 Fax: +1-732-549-5157 E-Mail: info@jobinyvon.com 1-800-533-5946 In France: 16-18, rue du Canal 91165 Longjumeau cedex Tel: +33 (0) 1 64 54 13 00 Fax: +33 (0) 1 69 09 93 19 when photon emission is too weak for frequency-domain detection. There is a sacrifice in available wavelengths for UV excitation, important for some biological samples, when the flash lamp is used, and may be inconvenient and slow. Most important for you, Jobin Yvon, uniting Spex® and IBH, now offers both time- and frequency-domain instruments to optimize your research time and effort. The choice is yours. Copyright © 2004 Jobin Yvon, Inc. 1 R.A. Lampert, et al., Anal. Chem., 55:68–73, 1983. J.R. Lakowicz, et al., J. Fluor., 1(2):87–93, 1991. 3 G. Hungerford and D.J.S. Birch, Meas. Sci. Tech., 7:121– 135, 1996. 4 D.M. Jameson and T.L. Hazlett, Biophysical and Biochemical Aspects of Fluorescence Spectroscopy, Plenum Press, New York, pp. 105–133, 1991. 5 E. Gratton, et al., Ann. Rev. Biophys. Bioeng., 13:105– 124, 1984. 2 Japan: +81 (0) 3 58230140 China: +86 (0) 10 6849 2216 Germany: +49 (0) 89 462317-0 Italy: +39 0 2 57604762 U.K.: +44 (0) 8204 8142


