Summarizing Data: Paired Quantitative Data • regression line a
advertisement

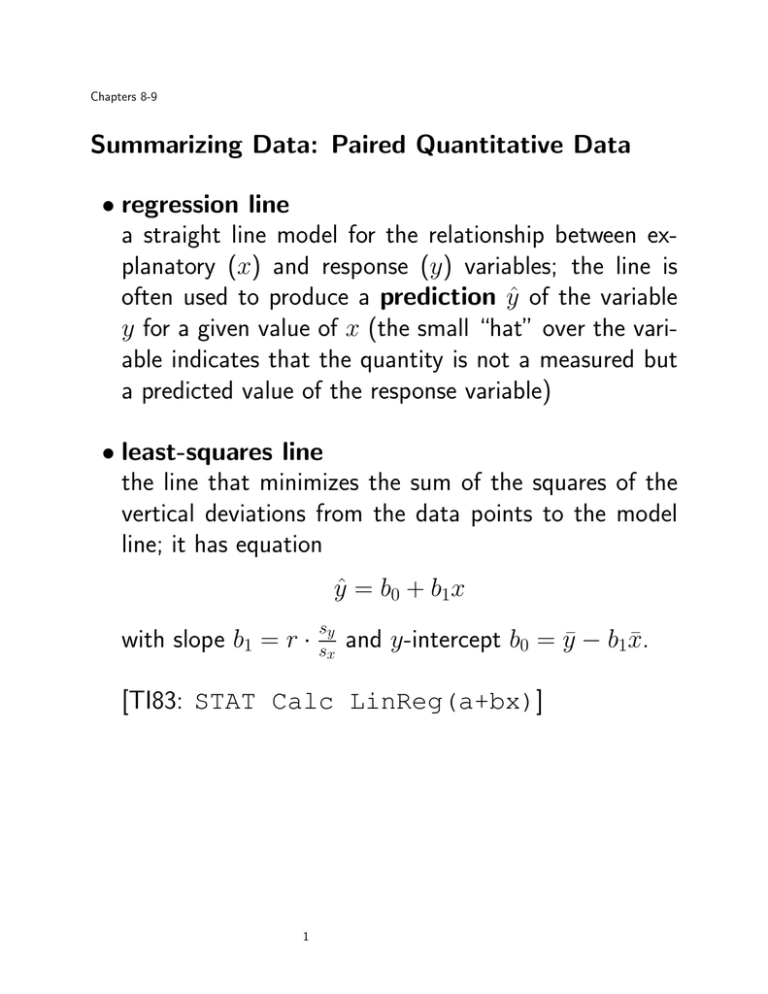
Chapters 8-9 Summarizing Data: Paired Quantitative Data • regression line a straight line model for the relationship between explanatory (x) and response (y) variables; the line is often used to produce a prediction ŷ of the variable y for a given value of x (the small “hat” over the variable indicates that the quantity is not a measured but a predicted value of the response variable) • least-squares line the line that minimizes the sum of the squares of the vertical deviations from the data points to the model line; it has equation ŷ = b0 + b1x s with slope b1 = r · sxy and y-intercept b0 = ȳ − b1x̄. [TI83: STAT Calc LinReg(a+bx)] 1 Chapters 8-9 Assumptions for using the linear regression model • Quantitative Variables Condition both variables are quantitative variables • Straight Enough Condition a scatterplot of the data looks reasonably straight • Outlier Condition correlation is highly sensitive to outliers 2 Chapters 8-9 Analyzing Paired Quantitative Data: Using the least-squares line • The least-squares regression line is determined by minimizing y-deviations from the data values, so switching explanatory and response variables will generate a different least-squares line. • The least-squares line always passes through the point of means (x̄, ȳ). That is, the predicted response for the average value of the explanatory variable x̄ must equal the average value of the response variable. • An increase in the value of x by one standard deviation sx corresponds to a change in ŷ of r times a standard deviation sy . Thus, since r lies between −1 and +1, predicted values of ŷ lie closer to their mean value ȳ than the corresponding x values are from their mean value x̄. (We say that the predicted ŷ values regress towards their mean. This is why correlation is denoted r; it is a measure of this regression.) 3 Chapters 8-9 • coefficient of determination (r2 or R2) measures the percentage of total variation in y values that is due to their linear association with their corresponding x values. • residual (Resid) the deviation y − ȳ between the measured value of the response variable and its corresponding predicted value on the regression line; the mean of the residuals always equals 0. • residual plot a scatterplot of pairs (x, Resid), used to evaluate whether a linear model is appropriate: if it is, the residual plot should be absent of any patterns or trends [TI83: StatPlot, use Ylist:RESID] • residual standard deviation (se) a measure of how far a typical point can lie above or below the regression line, or the size of a typical residual: rP (y − ȳ)2 se = n−2 [TI83: STAT TESTS LinRegTTest, find s] 4 Chapters 8-9 Analyzing Paired Quantitative Data: Linear Regression “wisdom” • Residual plots are an indispensable tool for analyzing the suitability of the linear model; the data should be homogeneous, that is, there should not be subgroups of the data which differ from each other in some respect (often recognizable in a residual plot) • The Straight Enough Condition warns us to check that the scatterplot be reasonably straight to ensure that the linear model is appropriate; deviations from straightness are often more easily noticed in a residual plot. • Regression formulas are often used to extrapolate, that is, to make predictions for y corresponding to x values beyond the range of the measured data but based on trends within the range of the data; all such predictions are suspect, and the further one extrapolates, the more suspect the prediction! • The Outlier Condition warns us to be on guard for outliers in the data, points with large deviations in x or y, or both; such points can be influential, in the sense that the size of the correlation (hence also the regression formula) can change dramatically when that outlier is removed from the data set. 5 Chapters 8-9 • A residual plot can also identify outliers having high leverage, the tendency to singlehandedly change the direction of the regression line by a noticeable amount; treat them in the same way as influential points. • Outliers in the data need not be “bad”, and should not be dismissed out of hand or discarded only so as to strengthen the association between the variables; they should rather be explained: let the data honestly speak for itself. • A high correlation does not necessarily signify a causative relationship. There may be a strong association between variables without there being a cause/effect relation between them, since both the explanatory and response variables might be influenced by a third lurking variable that has not been measured. • Correlations between paired data sets based on averaged data smooth out much of the natural variation in raw measurements and naturally tend to be very high; predictions in these cases may be unreliable when applied to individual cases. 6


