The Small-Signal Frequency Response of Ferrites
advertisement
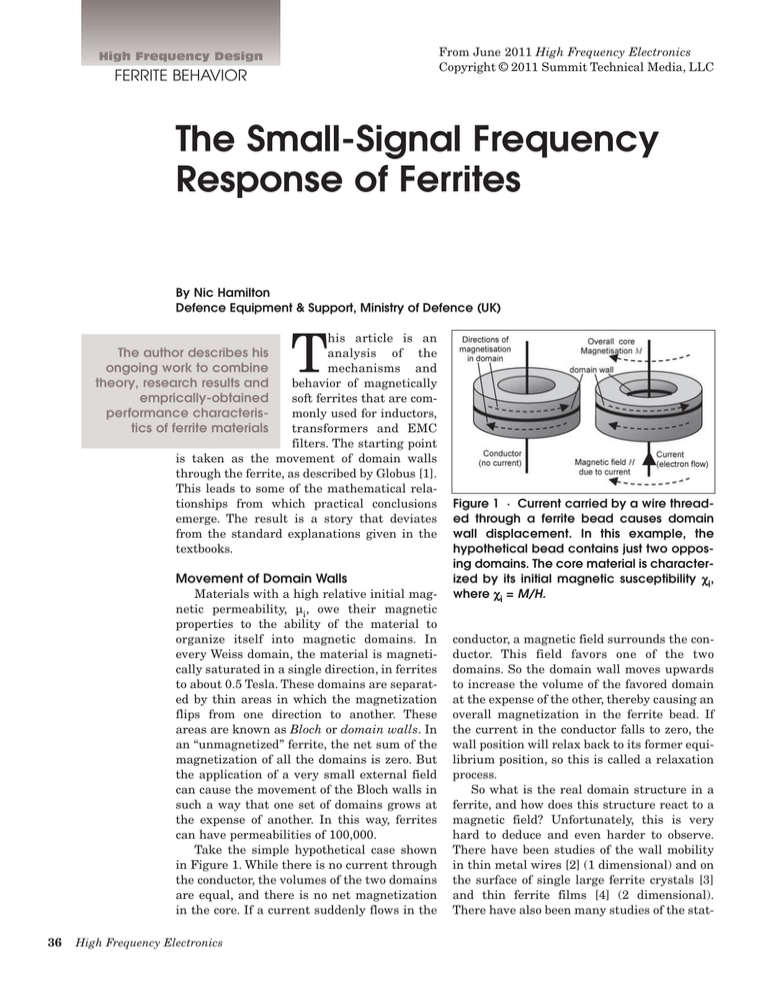
From June 2011 High Frequency Electronics Copyright © 2011 Summit Technical Media, LLC High Frequency Design FERRITE BEHAVIOR The Small-Signal Frequency Response of Ferrites By Nic Hamilton Defence Equipment & Support, Ministry of Defence (UK) T his article is an analysis of the mechanisms and behavior of magnetically soft ferrites that are commonly used for inductors, transformers and EMC filters. The starting point is taken as the movement of domain walls through the ferrite, as described by Globus [1]. This leads to some of the mathematical relationships from which practical conclusions emerge. The result is a story that deviates from the standard explanations given in the textbooks. The author describes his ongoing work to combine theory, research results and emprically-obtained performance characteristics of ferrite materials Movement of Domain Walls Materials with a high relative initial magnetic permeability, µi, owe their magnetic properties to the ability of the material to organize itself into magnetic domains. In every Weiss domain, the material is magnetically saturated in a single direction, in ferrites to about 0.5 Tesla. These domains are separated by thin areas in which the magnetization flips from one direction to another. These areas are known as Bloch or domain walls. In an “unmagnetized” ferrite, the net sum of the magnetization of all the domains is zero. But the application of a very small external field can cause the movement of the Bloch walls in such a way that one set of domains grows at the expense of another. In this way, ferrites can have permeabilities of 100,000. Take the simple hypothetical case shown in Figure 1. While there is no current through the conductor, the volumes of the two domains are equal, and there is no net magnetization in the core. If a current suddenly flows in the 36 High Frequency Electronics Figure 1 · Current carried by a wire threaded through a ferrite bead causes domain wall displacement. In this example, the hypothetical bead contains just two opposing domains. The core material is characterized by its initial magnetic susceptibility χi, where χi = M/H. conductor, a magnetic field surrounds the conductor. This field favors one of the two domains. So the domain wall moves upwards to increase the volume of the favored domain at the expense of the other, thereby causing an overall magnetization in the ferrite bead. If the current in the conductor falls to zero, the wall position will relax back to its former equilibrium position, so this is called a relaxation process. So what is the real domain structure in a ferrite, and how does this structure react to a magnetic field? Unfortunately, this is very hard to deduce and even harder to observe. There have been studies of the wall mobility in thin metal wires [2] (1 dimensional) and on the surface of single large ferrite crystals [3] and thin ferrite films [4] (2 dimensional). There have also been many studies of the stat- High Frequency Design FERRITE BEHAVIOR mathematics of a single exponential relaxation process known as a Debye Relaxation. It is the speed of the motion of the domain walls and their associated time constant and hence phase delay that causes the frequency response of ferrites. Complex Permeability Figure 2 · The core magnetization M (red curve) changing with time (expressed in time constants τ) showing the response to a step change in coil current. M exponentially increases towards its final value as time increases. Initial gradient (dashed blue line) is 1. ic magnetization showing at the surfaces of bulk materials. The conclusions are that domain wall mobility is not a simple matter and that some highly complex magnetic structures can be generated even in a perfectly uniform crystal of material. And most ferrites consist of small crystals (grains) jammed tightly together, separated by very thin grain boundaries. So the ferrite in an RF core is a material that consists of a foam of grain boundaries that separate crystallites with random crystal orientations. The magnetic domain walls can also be considered as having a foam structure. Electron microscopy [4] of some MnZn ferrites has lead to the conclusion that, in the absence of an external magnetic field, the structural and magnetic foams are roughly the same: the magnetic walls follow the grain boundaries. Measurements also confirm logic, which tells us that a magnetically saturated core can have no domain walls. The magnetization is said to “drive out” the domain walls. In the hypothetical case of Figure 1, when the domain wall reaches the upper surface of the ferrite, it ceases to exist. Current techniques do not allow observation of the movement of domain walls in a bulk material, and, under the small-signal conditions discussed here, the wall movement would be hard to detect because it approximates to zero. So research on this topic has become a topic for those interested in computer simulations. In the face of all this complexity, it might be assumed that a mathematical analysis of the frequency response of ferrite would be a hopeless enterprise. It is not; it turns out that the model of Figure 1 works well for small signals. Domain walls cannot be moved instantaneously; they propagate through the ferrite at a finite speed, which may be visualized in the model in Figure 1. This single relaxation mechanism is modelled as an exponential; the exponential change in magnetization with time is illustrated in Figure 2. Measurements show that Figure 2 is very similar to the actual response of ferrite. This is fortunate, because Peter Debye, in his book Polar Molecules, analyzed the 38 High Frequency Electronics The chief “data book” characteristic of ferrite material is the relative initial permeability µi. This is measured with “a very small signal” and “nearly at dc.” In the absence of a magnetic core, µi = 1, but typical values for ferrite lie between 50 and 100,000. To characterize the material across the frequency spectrum, the idea of complex permeability is introduced as the following: μ* = μ′ − jμ′′ in which all three terms are functions of frequency and where µ' represents the real “reactive” part and µ" the imaginary “resistive” part, and j is √–1. The * indicates that the variable is complex. µi is often considered as the limiting value at very low frequency, the quasi-static value, but can be calculated at other frequencies. Complex Susceptibility Related to Permeability Permeability is an excellent measure for engineering purposes, but, from the point of view of physics, it is much more convenient to use the magnetic susceptibility when considering the material. The initial magnetic susceptibility, often known simply as initial susceptibility χi is related to permeability by: χi = µi – 1 . Susceptibility may also be expressed in complex terms: χ* = χ′ − jχ′′ So that: χ′ = μ′ − 1 and χ′′ = μ′′ The physics of the matter is that: μ 0 μ* = B* H and χ* = M* H Where H is the driving magnetic field strength, B is the magnetic flux density, and M is the magnetization. In practical terms, the relative permeability of free space is 1, but its susceptibility is 0. A coil of wire will have an inductance at low frequencies, even in the absence of a magnetic core. By switching from permeability to susceptibility, we effectively remove that inductance, and ask “what is the additional inductance due to the presence of the core?” But as the manufacturing tolerance of the permeability of ferrite cores without an air High Frequency Design FERRITE BEHAVIOR Figure 3 · Normalized real (solid blue) and imaginary (dashed red) parts of complex series susceptibility spectrum. Left: log/linear, right log/log. Figure 4 · Normalized real and imaginary parts of complex parallel susceptibility spectrum. Compare with series version in Figure 3. gap is usually ±20%, and permeability is much greater than 10, the difference between permeability and susceptibility is usually a technical nicety. for the inductive component, and the red/orange trace is the imaginary part that is responsible for the resistive component. Note that there is a frequency beyond which the inductive part of the susceptibility is said to “roll-off” in an analogy to a low-pass filter, and, nearby, a frequency at which the lossy part is said to peak, or, by some, to resonate. Note also that the two graphs cross where ωτ = 1, and where µ' = µ" = 0.5. Theoretical Susceptibility Spectrum Consider the core of Figure 1 with a time response of Figure 2, with its single relaxation with a time constant of τ seconds and under the excitation of an angular frequency of ω radians per second. Then, using the Laplace transform, the material’s permeability spectrum in response to an applied ac magnetic field can be found [5], and expressed as a susceptibility as: χ* = χi 1 1 − jωτ (1) Which is the magnetic equivalent of the Debye equation, which is normally applied to dielectrics. Collecting the real and imaginary parts gives: χ* = χi 1 ωτ − jχi 1 + (ωτ)2 1 + (ωτ)2 (2) and resolving Equation 2 into a complex magnetic susceptibility gives: χ′S = χi 1 1 + (ωτ)2 χ′′S = χi ωτ 1 + (ωτ)2 (3) The S subscript of the susceptibility indicates that the real and imaginary parts are considered as components in series and relate to a model of an inductor in series with a resistor. The values of the inductor and resistor are functions of frequency. The series nature of the circuit is important but is frequently missed in discussions of this matter. Equations 3 are shown as normalized graphs in Figure 3. The log/log graph on the right of Figure 3 is familiar as the basis of the spectra characterizing the material given in innumerable data books and papers for magnetic and dielectric materials. In these and following graphs, the blue trace is the real part that is responsible 40 High Frequency Electronics Data Derived From the Susceptibility Spectrum Materials scientists are interested in the magnetic losses that cause the phase shift δm between the driving magnetic field strength H and the magnetization M. The engineer is more often interested in its reciprocal, the material quality factor Qm. tan δm = 1 χ′′S = χ′S Qm (4) Also, by inserting an air-gap in the magnetic path, Qm can be traded off against the initial permeability. So, by including an air-gap to halve the effective permeability, the effective Qm is doubled. This gives rise to the Dissipation Factor, DF, or Residual Loss Factor, the use of which has been attributed to J. L. Snoek and W. Six. DF = tan δm 1 = μi Qmμ i (5) So DF has the following uses: a. As a material figure of merit, so that different ferrites may be compared one with the other. b. In the calculation of the effects of an air gap. The literature also states that the permeability (and hence susceptibility) may also be expressed in parallel terms. And this, with the exception of the Snoek limit, which we will come to later, represents the general limit of the analysis contained in the textbooks. High Frequency Design FERRITE BEHAVIOR Parallel Susceptibility Spectrum The parallel form of susceptibility (with the P subscript) can be derived from the series form using the standard equations for conversion of impedance to admittance: χ′P = χ′S 2 + χ′′S 2 χ′S χ′′P = χ′S 2 + χ′′S 2 χ′′S (6) And substituting Equations 3 into Equations 6 gives the following solution: χ′P = χi χ′′P = χi ωτ (7) This is a result that can be inferred from the literature [7], but it has been shown in detail here because it does not seem to be explicitly stated elsewhere. So the parallel susceptibility is plainly simpler than the series form [8] and graphs are shown in Figure 4, which may be compared to the series form in Figure 3. Especially note that the parallel susceptibility spectrum does not show any hint of resonance, but, as with the series form, µ' = µ" = 0.5 where ωτ = 1. Equations 7 imply that the parallel susceptibility spectrum contains the basic information about the material performance. The real part χP' does not depend on frequency and tells of the static performance and demagnetization effects such as an air-gap. The imaginary part χP" is a function of frequency, tells of the dynamic performance, and is directly related to domain wall mobility. Material Q and the Dissipation Factor As the permeability can be expressed in terms of ωτ, it follows from Equation 3 that this also applies to Q. tan δm = 1 χ′′S χ′P = = ωτ = χ′S χ′′P Qm (8) Applying the same logic to Equation 5 for DF, but approximating χi ≈ µi gives DF = tan δm 1 ωτ 1 = ≈ = μi Qmμ i χi χ′′P (9) So the graphs of DF that have traditionally been used to compare the relative merits of various ferrites at various frequencies [9] are exceedingly closely related to reciprocals of the complex part of the parallel susceptibility and hence to the domain wall mobility. It should come as no surprise that ferrites perform better at high frequencies if they have relatively nimble domain walls. Domain Wall Size and Mobility Having stated that Figure 1 is hypothetical in that it 42 High Frequency Electronics has just two domains, and that Globus [1] named the whole topic the “domain wall size theory,” it is reasonable to ask about the actual size, or rather the total domain wall surface area in a ferrite bead. If Figure 1 is taken as a 1/2 inch O/D toroid with the usual dimensions, then the single disc domain wall has an area of 90 mm2. If the torroid’s ferrite consists of grains of 10 µm diameter, and if the domain walls follow the grain boundaries [4], then the actual wall area is about 90,000 mm2; about 1,000 times the area of the single domain wall. So how quickly do the domain walls move through ferrite? Not quickly at all; wall velocity depends on the current magnetisation and current % of final magnetization value, and many other factors, including the resistivity of the ferrite within the grains, but a sensible choice of unit of measurement of the wall velocity might be meters per second. From this, many investigators have inferred that the movement of domain walls is too slow a process to be the cause of ferrites’ performance at, say, 10 MHz. This is not true. Although Figure 4 shows that χP" ∞ 1/ƒ, the value of the resulting resistance RP ∞ χP"ƒ, so the effects of frequency cancel, and equivalent parallel resistance due to movement of the domain walls tends to be constant with increasing frequency. And this is in spite of the fact that, in ferrites, the sluggishness of the domain walls often starts to show its effects on µ" near 10 kHz. Susceptibility Expressed as Lumped Elements Susceptibility can be converted to permeability and then denormalized for the size and shape of the core (assuming no air-gap) to give an equivalent inductor and resistor. In the series circuit, the values of L and R are strong functions of frequency, so this approach is not very useful. But the parallel susceptibility converts to an inductor and resistor in a parallel equivalent circuit. This should come as no surprise: the circuit models and the series and parallel comparative graphs in the text-books already tell us that this is so [10]. Adding Low-Field Hysteresis Comparing the graphs of measured parallel permeability spectra [10] with Figure 4 shows an immediate problem: as the frequency falls towards zero, Figure 4 predicts that the material Q becomes infinite, but measurements show it to be finite. There is a signal loss associated with propagating waves through any substance, and a domain wall is a type of wave. The lumped element model must have a further “component” in parallel with the Debye components, as shown in Figure 5. By adding the parallel admittances of the “resistive”components, the imaginary part of the parallel permeability must be: High Frequency Design FERRITE BEHAVIOR Figure 5 · “Three component” model of ferrite material’s permeability. The inductor is split to show the series assumption underlying the definition of permeability. Debye components are a standard inductor and resistor, but the quasi-static loss is a frequency-dependent resistor, simulating the hysteresis loss per cycle. χ′′P = χ0 [ ωτ + tan δm ] -1 (10) Using this formula, and the model of Figure 5, it is possible to build moderately accurate models of ferrites at small signals; Figure 6 shows such a model for a typical ferrite in the parallel susceptibility form, and the same data converted to the series susceptibility representation. But be clear about the nature of the additional frequency dependent resistor (FDR). The loss of this “resistor” is proportional to the number of times the driving signal takes the material round its hysteresis loop in a given time. It is difficult to model FDRs in SPICE and similar simulators in such a way that the model will run in both time and frequency domains. The most convenient approximation to the frequency dependent resistor is an LR ladder network; this can model over a finite frequency range and with a finite accuracy using a finite (but large) number of LR pairs in the ladder. The FDR also arises in using circuit simulators to model skin effect [11]. The symbol for the FDR was adopted from [12]. Relaxation or Resonance? Snoek’s View Dr. J. L. Snoek of Philips in the Netherlands wrote a slim book [13] “intended as a report on our researches during the [Second World] war under conditions which became gradually harder and in an atmosphere ill suited to scientific thought.” Snoek’s book showed how ferrites could be manufactured to give permeabilities much greater than had been previously achieved by Drs. Kato and Takei of what was to become TDK Corporation. Snoek’s book made him the leading authority on the 44 High Frequency Electronics Figure 6 · Model of the susceptibility spectrum of a typical ferrite, with µi = 2000, Qm = 200 and ƒχP" = 7.5 GHz, giving a single relaxation frequency ƒr = 3.75 MHz. a) Upper graph: parallel susceptibility, converted in b) Lower graph: to the series representation. subject in the West. In the 1947 1st edition of the book, Snoek stated that the increasing loss with increasing frequency in ferrite was due to losses associated with domain wall relaxation. However, in a much-cited paper published in May 1948 [14], Snoek had a change of opinion. He asserted that the increasing loss with increasing frequency in ferrite was due to a resonance caused by rotation of the magnetisation, an effect predicted by Landau and Lifshitz in 1935. Snoek also asserted that the movement of the domain walls was “a lower-frequency and less prominent effect.” But Snoek had not included any detailed high frequency measurements that could illuminate the matter. These were soon published and showed just one “resonance” in materials with Snoek’s Constant (a measure of goodness defined later) ƒχP" = 4 GHz. High Frequency Design FERRITE BEHAVIOR Figure 7 · Characterization of a 1/2-inch diameter core. Left: 10 turn winding presents sufficient impedance for a reliable measurement at LF. The trifilar winding minimizes winding loss. Right: The same core fitted in a coaxial short using a GR900 50 ohm connector, which provides a single turn for VHF measurement and will accept cores with an outside diameter of less than 14 mm. Rado et al. did not agree [15]. From their measurements of a magnesium ferrite (χi = 19 ƒχP" = 0.7 GHz, a poor ferrite), they concluded that the main effect was due to domain wall movement at low frequency, with resonance in the GHz region due to magnetization rotation. Rado’s paper was published in October 1950. Snoek had regrettably little time to respond; he died in an automobile accident in Indiana two months later [16]. I suspect that this tragedy prevented the scientific community from arriving at a consensus opinion, so an air of irresolution still persists: is it resonance due to magnetization rotation or is it relaxation due to domain wall translation? Current books form a spectrum of opinion; the bookends are perhaps Dionne’s Magnetic Oxides and Valenzuela’s Magnetic Ceramics. Snoek’s Constant and the Time Constant The basis for Snoek’s assertion of resonance was that the mathematics predicted that the following relationship held for cubic (the usual type) ferrites: ω0χ = 3 gM 2 (11) Where ω0 is the critical frequency, χ is the low frequency susceptibility, g is the gyromagnetic ratio and M is the material’s magnetic moment per cm3. The critical frequency may be taken to be that at which χs" peaks. Equation 11 has proved to be a reasonable approximation [17]. In addition, as the right side of Equation 11 is fairly constant, it predicts that there is a direct trade-off between ω0 and χ. Thus, a high permeability material will only be useable to a low frequency, and a low permeability material is needed for good high frequency performance. This, too, is approximately true. Equation 11 is 46 High Frequency Electronics Figure 8 · Measured susceptibility spectrum of a “high Q” NiZn ferrite (Fair-Rite 61). Also shown, a relaxation χP" = 7.5 GHz model with µi = 100, Qm = 150 and ƒχ (graph expanded to show this). widely known as the Snoek relationship, and the product ƒrχ, is known as Snoek’s Constant, Product or Limit. It is often expressed as ƒr(µs – 1), where the subscript s refers to the static [18] or low-frequency initial permeability, rather than indicating the series permeability used in this article. It also appears as the simple value S in some texts. For a modern NiZn ferrite, its value is about 7.5 GHz [17]. This constant is very useful: it enables the time constant τ to be evaluated, allowing easy use of Equations 7 and 10 to produce a reasonably accurate representation of a ferrite’s permeability spectrum. Note that Snoek’s Constant expressed as ƒrχ refers to a single point (ƒr, χS') on the series permeability spectrum for a given ferrite; this is illustrated in Figure 6b. But, looking at Figure 6a, it is clear that all points on the ƒχP" curve at frequencies at which the quasi-static loss component is small (greater than 0.1 MHz in this example) satisfy Snoek’s Constant, which is inherent in the mathematics of a single relaxation. So Snoek’s Constant is a broad-band value in the parallel permeability representation and happens also to apply to the series representation because it refers to ƒr, the relaxation frequency. At this frequency, the ferrite’s Q passes through 1 and is, therefore, the unique frequency at which Snoek’s Constant also applies in the series permeability representation. So I propose that Snoek’s Constant be ƒχP" when applied to relaxation. And it has already been shown that RP ∞ χP"ƒ. Measuring the Permeability Spectra The permeability spectra are derived from impedance measurements. At LF, the impedance per turn is low, and a multi-turn coil must be used so that the impedance High Frequency Design FERRITE BEHAVIOR becomes large enough compared to 50 ohms for a successful measurement of the very small phase angle. But at UHF, multiple turns become a significant portion of a wavelength, and this contaminates the measurement. So it is normal to use a vector network analyzer to measure the core in a coaxial line [19]. Test windings of these two sorts are illustrated in Figure 7. For coaxial measurements, it is standard practice to do an Open/Short/Load (OSL) calibration to remove the effects of the connectors, but using an OSL calibration normalizes out the inductance of the coaxial “single turn.” So multi-turn coil impedance measurements converted to the core properties give the material’s permeability, whereas the same process starting with an OSL normalised coaxial measurement gives the material’s magnetic susceptibility. Measured Permeability Spectra The “three component” relaxation model of Figure 5 gives a good fit for many materials such as metals and “low Q” ferrites intended for RFI filters and transformers. However, some “high Q” ferrites are not immediately amenable to this modeling: an example is shown in Figure 8, which shows both measured and relaxation modelled results. A comparison of these shows the prime aim of the manufacturer in the development of this ferrite: to defer the onset of the fall in the material’s Q to a higher frequency than can be achieved using a pure relaxation process. This extends the “high Q” ferrite’s frequency range by about a decade. This may be achieved in ferrites consisting of a mixture of small and large grains, whereas a uniform grain size gives a relaxation characteristic [20]. Figure 8 shows other features. The measured χP' is not quite constant. This is because χP' and χP" (ignoring the hysteresis loss) are governed by the Kramers-Kronig relations. So the deviation in χP" away from the model with its 1/ƒ relationship automatically means that χP' cannot be constant. But this also implies that a very careful measurement of the χP' could, in theory, be mathematically transformed to show the frequency spectrum of χP" if there was no hysteresis loss. In this way, the shape of the “mountain-tops” of the low-frequency χP" spectrum may be revealed above the hysteresis loss “cloud line.” Permeability Converted to Impedance From the permeability spectrum, the resistance and reactance spectrum can be found. Z= j μ 0 μ * .2 π f . N 2 8π2 × 10 −7 × μ * × f × N 2 = j Ω C1 C1 (12) where C1 is the core constant, and N is the number of turns. Again, it is best to work in parallel terms, and the 48 High Frequency Electronics Figure 9 · The permeability data of Figure 8 converted to parallel resistance and reactance spectra normalized to 1 turn on a core with a core factor C1 = 1 mm-1. data of Figure 8 convert to the parallel resistance and reactance spectra of Figure 9. Apart from some normalization for the core constant, the main effect is to multiply the curves of Figure 8 by the frequency, so XP is proportional to ƒχP' and RP is proportional to ƒχP", which was given earlier as a definition of Snoek’s Constant, giving the useful approximation stated in Figure 9 for a NiZn ferrite. For a MnZn ferrite, replace the constant 60 by 40. This is an approximation that I found by experiment [21], but it is only now that I understand its derivation from Snoek’s constant. Definition of “Low Signal” This article is called “The Small-Signal Frequency Response of Ferrites,” a title that carries with it a threat that none of this applies as power levels increase. So, to what amplitude does all this remain good? Of the circuit elements in Figure 5, the quasi-static loss (hysteresis loss) component is the most prone to change as the signal level increases. As signal amplitude increases, the effect on the permeability spectrum is the progressive reduction of the material Qm. With 12 turns on a 1/2-inch core, the measured value of χP" starts to decrease as the available power exceeds –15 dBm, giving an rms flux density of 0.3 mT as the point at which Q starts to fall. The effect is to progressively reduce the peak value of Rp. However, the values of the “Debye components” are much more stable with increasing magnetization. The inductance increases to a peak at about 200 mT, and then diminishes at the onset of magnetic saturation. Clearly, at these amplitudes, the core starts to generate significant harmonic energy, and using a VNA to measure the High Frequency Design FERRITE BEHAVIOR S parameters becomes a poorer approximation to reality. Another threat to the “low signal” performance is the application of a strong static magnetic field. This can cause the magneto-strictive properties of the ferrite to become apparent. Magneto-striction is the magnetic equivalent of piezoelectricity in a dielectric; apply a magnetic field, ferrite crystallites change shape by a small amount. Just as a quartz crystal can be used as an ultrasonic acoustic resonator, applying a strong static magnetic field to a NiZn ferrite can cause extremely high Q ultrasonic acoustic resonances of the core. Air Gaps and Parallel Permeability Spectra As stated above, an air-gap reduces the effective initial permeability, but that price buys increased Qm, enhanced temperature stability and a tighter tolerance of the effective initial permeability. It also buys an extended frequency range for a given Qm, and it would be reasonable to expect to see this frequency extension on the graphs of permeability spectra. The series permeability is not suited to calculation of the effects of an air-gap, DF has been used instead. But as DF ≈ 1/χP", it is no surprise that the effect of an air-gap on the parallel permeability spectra is simply to reduce χP', and the relaxation frequency (at which χP' = χP" ), increases by the correct amount. Why is the Series Permeability Used? If the advantages of using the parallel form of permeability are so overwhelming, why does all the literature use the series form? I think there are two main reasons. First, We are educated to think in terms of impedance rather than admittance. Second, the mathematics of the definition of permeability, µi = χi +1 defines a series circuit of two inductors, as shown in Figure 5, one being the air core inductance, and the other being the additional inductance due to the magnetic core. Once started on a series circuit, it is easier to continue and pay the price of making the value of this resistance a strong function of frequency. A fringe benefit of the series approach is that the material loss resistance can then be lumped together with the series resistance due to dc resistance and skin effect in the practical inductor. Figure 10 · The series and parallel families of magnetic and electronic variables. Each pair of terms can be converted to the adjacent pairs of terms. A dashed line separates terms with a reciprocal relationship; a solid line represents other relationships. G is the conductance and B the susceptance in Siemens. A top row could be added: Series models (in parallel terms), but is of little practical use here. could be the magnetic immunity, the use of which would simplify the mathematics and remove the need to differentiate between series and parallel susceptibility. Figure 10 summarizes the various relationships. For example, Equations 6 convert series susceptibility into parallel susceptibility. Figure 10 shows the separate steps underlying Equations 6; take χS' and χS" and assemble χ*, then take the complex reciprocal to give the immunity ι*, separate the real and imaginary parts of immunity and take their individual reciprocals to give the answer χP' and χP". This final step would be unnecessary if we were prepared to use immunity as a property in its own right. Using this logic, the Dissipation Factor DF is just the imaginary part of the immunity. So, just as denormalization of complex permeability leads to impedance, denormalization of complex reluctivity would lead to admittance. Conclusions Even though this article is about ferrites, the mathematics, with a little adjustment for leading or lagging phasors, apply to all reactive components with high relative permeability or permittivity. The main conclusions are: Reciprocal Terms: Completing the Terminology Just as the reciprocal of impedance is admittance, so the reciprocal of permeability is reluctivity. Snoek found it convenient to use reluctivity in his study [22] of slow magnetic relaxations in 1938, but it is little used in the discussion of ferrite’s magnetism today. Fundamental relationships in magnetism are the Curie and Curie-Weiss Laws for paramagnetic materials, where the inverse susceptibility is related to temperature. Perhaps the reciprocal of magnetic susceptibility 50 High Frequency Electronics • Ferrite cored inductors must be modeled as a parallel circuit. This follows directly from two initial assumptions: (1) The core magnetization changes exponentially in response to a step change in coil current (2) The inductance of the coil’s winding in the absence of the core provides a negligible contribution to the total inductance in the presence of the core. High Frequency Design FERRITE BEHAVIOR • The complex permeability spectrum is used to characterize materials and may be expressed in series or parallel terms. A series expression is usual but is misleading: the parallel expression gives a clearer indication of what is happening in the material. This is a truth more widely appreciated in the field of dielectrics [12] than in magnetics. • The frequency at which the material Q = 1 is the relaxation frequency. There is no resonance at this frequency, rather, the maximum in the imaginary part of the series permeability (and its associated Cole-Cole plot) is a mathematical artifact caused by analyzing a parallel circuit in series terms. • At the relaxation frequency and higher, the parallel resistance dominates and can be found from Snoek’s constant, which, although not usually quoted in the data books, is a vital characteristic that indicates the material’s domain wall mobility. • For cubic (standard) ferrites, the value of Snoek’s constant is about 7 GHz for a high quality NiZn, and about 4 GHz for a MnZn ferrite. This gives most ferrites for EMC filters or transformers similar HF performance, if capacitance and line-length effects are ignored. References 1. A. Globus, “Some Physical Considerations about the Domain Wall Size Theory of Magnetization Mechanisms,” 2nd International Conference on Ferrites (ICF2-1976). J. de Physique, 1977, C1-38, C1 pp. 1-15. 2. G. S. D. Beach, C. Nistor, C. Knutson, M. Tsoi, and J.L. Erskine, “Dynamics of field-driven domain-wall propagation in ferromagnetic nanowires,” Nature Materials, 2005, Vol 4, pp. 741-744. 3. J. K. Galt, “Motion of a Ferromagnetic Domain Wall in Fe3O4,” Physical Review, Vol 85 No 4, 15 Feb 1952. 4. T. Kasahara, H. S. Park, D. Shindo, H. Yoshikawa, T. Sato, and K. Kondo, “In situ observations of domain wall motion in Mn-Zn and Ni-Zn ferrites by Lorentz microscopy and electron holography” J. Magnetism and Magnetic Materials, Vol 305 Iss 1, October 2006, pp 165-170 5. J. Smit and H. P. J. Wijn, Ferrites, John Wiley, 1959, p. 290. 6. H. P. J. Wijn, “Some remarks on the history of ferrite research in Europe,” Proceedings of the International Conf. on Ferrites (ICF1-1970), University Park Press, 1971, pp. xix-xxiii. 7. H. Saotome and Y. Sakaki, “Complex Permeability of Polycrystalline Mn-Zn and Ni-Zn Ferrites,” Electrical Engineering in Japan, Vol 123, No 2, Feb 1998 pp. 1-7. Reproduced in Classic Works in RF Engineering, Ed. Walker, Myer, Raab and Trask, Artech House, 2006 pp. 3339. 8. J. K. Watson and S. Amoni, “Using parallel complex 52 High Frequency Electronics permeability for ferrite characterisation” (pp. 4224-4226) and “A four-component model for high-µ ferrites” (pp. 4227-4229), in IEEE Trans Magnetics, Vol 25, No 5, Sept 1989. 9. E. C. Snelling, Soft Ferrites, Properties and Applications, 2nd Edition, Butterworths, 1988, pp. 99-102. 10. E. C. Snelling, Op. Cit., model p.204, graphs pp. 9298. 11. S. Kim and D. P. Neikirk, “Compact equivalent circuit model for the Skin Effect,” IEEE MTT-S International Microwave Symposium Digest, 1996, Vol 3, pp. 1815-1818. 12. S. Grimnes and Ø. G. Martinsen, Bioimpedance and Bioelectricity Basics, Academic Press, 2000, Chapter 7. 13. J. L. Snoek, New Developments in Ferromagnetic Materials, Elsevier, 1947, 2nd Ed., 1949. 14. J. L. Snoek, “Dispersion and absorption in magnetic ferrites at frequencies above one Mc/s,” Physica, Vol 14, No 4, May 1948, pp. 207-217. 15. G. T. Rado, R. W. Wright, and W. H. Emerson, “Ferromagnetism at Very High Frequencies. III. Two Mechanisms of Dispersion in a Ferrite,” Physical Review, Vol 80, No 2, Oct 1950, pp. 273-280. 16. Brief obituary, Physics Today, Vol 4, Iss 2, Feb 1951, p. 32. See also M. Koiwa “A note on Dr JL Snoek,” 13th Internat. Conf. Internal Friction and Ultrasonic Attenuation in Solids, Materials Sci. and Eng. A, Vol 370, Iss 1-2, 15 Apr 2004, pp. 9-11. 17. T. Nakamura, “Snoek’s limit in high-frequency permeability of polycrystalline Ni-Zn, Mg-Zn, and Ni-Zn-Cu spinel ferrites,” J. Appl. Phys, Vol 88, No 1, 1 July 2000, pp. 348-353. 18. R. Lebourgeois, J-P. Ganne, and B. Loret, “High frequency Mn Zn Power Ferrite” (ICF6-1996), J. de Physique, Mar 1997, supplement C1, pp. 105-108. 19. R. B. Goldfarb and H. E. Bussey, “Method for measuring complex permeability at radio frequencies,” Review of Scientific Instruments, Vol 58, No 4, Apr 1987, pp. 624627. 20. International Magnetics Association, “Soft Ferrites, a user’s guide,” 1998, p. 21. 21. N. Hamilton, “RF Auto-transformers—transmission line devices modelled using SPICE Part 2,” Electronics World, Dec 2002, pp. 20-26. 22. J. L. Snoek, “Time effects in magnetization,” Physica, Vol 5, No 8, Aug 1938, pp. 663-688. Author Information Nic Hamilton is a senior scientific officer and engineer at Defence Equipment & Support, Ministry of Defence (UK), where his work involves military avionics equipment. He would welcome comments regarding his ongoing work to better understand the RF charactersitics of ferrites. He can be reached by e-mail at: g4txg@hotmail.com
