Solution to HW5
advertisement

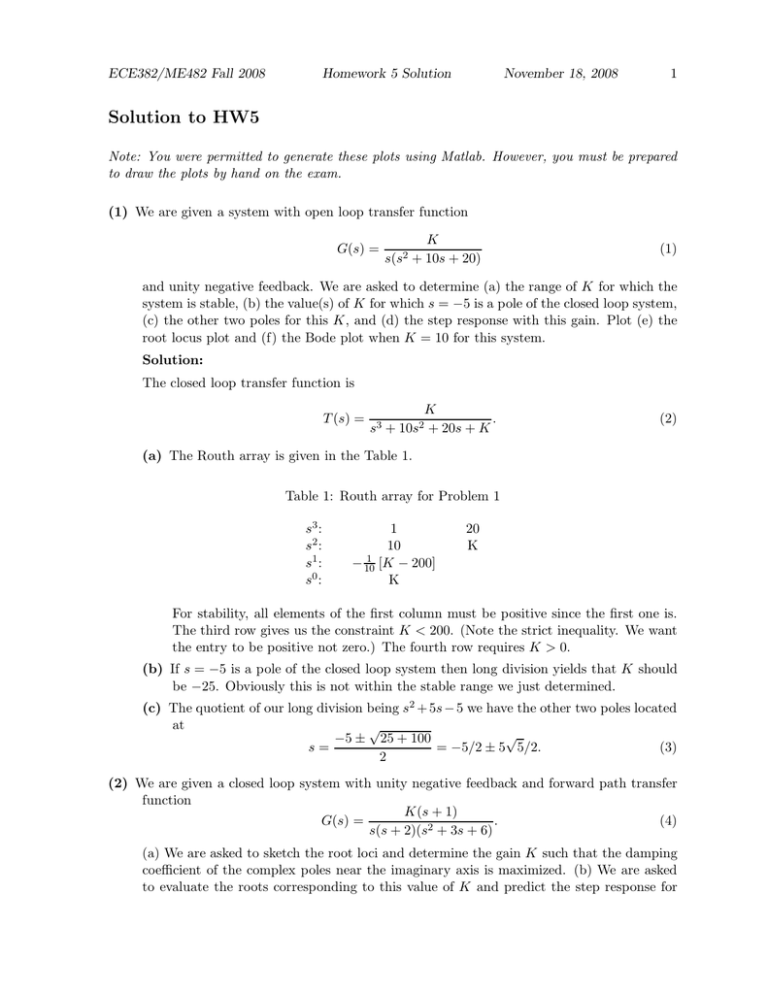
ECE382/ME482 Fall 2008 Homework 5 Solution November 18, 2008 1 Solution to HW5 Note: You were permitted to generate these plots using Matlab. However, you must be prepared to draw the plots by hand on the exam. (1) We are given a system with open loop transfer function G(s) = s(s2 K + 10s + 20) (1) and unity negative feedback. We are asked to determine (a) the range of K for which the system is stable, (b) the value(s) of K for which s = −5 is a pole of the closed loop system, (c) the other two poles for this K, and (d) the step response with this gain. Plot (e) the root locus plot and (f) the Bode plot when K = 10 for this system. Solution: The closed loop transfer function is T (s) = s3 + K . + 20s + K 10s2 (2) (a) The Routh array is given in the Table 1. Table 1: Routh array for Problem 1 s3 : s2 : s1 : s0 : 1 10 1 [K − 200] − 10 K 20 K For stability, all elements of the first column must be positive since the first one is. The third row gives us the constraint K < 200. (Note the strict inequality. We want the entry to be positive not zero.) The fourth row requires K > 0. (b) If s = −5 is a pole of the closed loop system then long division yields that K should be −25. Obviously this is not within the stable range we just determined. (c) The quotient of our long division being s2 + 5s − 5 we have the other two poles located at √ √ −5 ± 25 + 100 = −5/2 ± 5 5/2. s= (3) 2 (2) We are given a closed loop system with unity negative feedback and forward path transfer function K(s + 1) . (4) G(s) = s(s + 2)(s2 + 3s + 6) (a) We are asked to sketch the root loci and determine the gain K such that the damping coefficient of the complex poles near the imaginary axis is maximized. (b) We are asked to evaluate the roots corresponding to this value of K and predict the step response for ECE382/ME482 Fall 2008 Homework 5 Solution November 18, 2008 2 this value. (c) Finally we are asked to determine the actual response and compare it to our prediction. Solution: (a) We’ll work our way through the list of steps in Table 7.2 of the textbook. 1. Because we have unity negative feedback, our closed loop characteristic equation 1+ K(s + 1) =0 s(s + 2)(s2 + 3s + 6) (5) is already in the form 1 + KP (s) = 0 without any further manipulation. We need only factor the quadratic in the denominator to obtain √ √ (s2 + 3s + 6) = s − (−3/2 + j 15/2) s − (−3/2 − j 15/2) . (6) We see that we have two poles (one at the origin and one at −2) and one zero (at −1) on the real axis and two complex poles. There being 4 poles and only one zero, there will be four loci. 2. The real axis segments that will be part of the locus are the segment from −1 to 0 and the one from −∞ to -2. 3. The loci extend to the zeros at ∞ with asymptotes centered at σA and angles φA where 4 2+3−1 =− 4−1 3 2q + 1 = π = ±π/3, π. 3 σA = (7) φA (8) 4. We determine the points at which the loci cross the imaginary axes by using the Routh array to determine what value of K leads to instability. The Routh array is shown in Table 2. Table 2: Routh array for AP7.1a s4 : s3 : s2 : s1 : s0 : 1 5 (48 − K)/5 (K 2 − 11K − 576)/(K − 48) 5K 12 12 + K 5K K We see that we need K < 48 from line 3 and must factor the numerator of line 4. p Factoring K 2 − 11K − 576 = 0 yields K = −11/2 ± 121 + 4(576) ≈ 30.1, −19.1. To determine whether we want K between these values or outside these values we try a test point. If K = 0 we have (−576)/(−48) > 0 so we want the values between −19.1 and 30.1. From line 5 we need K positive so, summarizing, we have the requirement that 0 < K < 30.1. If K = 0, the denominator of T (s) does not have imaginary roots so the value we are looking for is K ≈ 30.1. (We ECE382/ME482 Fall 2008 Homework 5 Solution November 18, 2008 3 can verify this later by doing to root locus plot in Matlab.) When K = 30.1, the denominator of the transfer function of the closed loop system is s(s + 2)(s2 + 3s + 6) + K(s + 1) = s4 + 5s3 + 12s2 + 42.1s + 30.1 (9) which has roots −0.86, −4.1, and 0.0 ± 2.9j so the loci cross the imaginary axis near ±2.9j. 5. We have no breakin or breakout points. 6. To determine the angle of departure of the loci from the complex poles, I proceed as follows. I define the angle from the positive real √ axis to the segment connecting the pole at the origin to the pole at −3/2 + j 15/2 to be θ1 , the angle to the segment connecting the complex√ poles to be θ2 , the angle connecting the pole at −2 to the pole at −3/2 + j 15/2 to be θ3 , and√the angle to the segment connecting the zero at −1 to the pole at −3/2 √ + j 15/2 to be φ1 . I define the angle of departure from the pole at −3/2 + j 15/2 relative to the standard position to be θ. Then θ + θ1 + θ2 + θ3 − φ1 = 180 mod 360 deg (10) p θ1 = 180 − tan−1 (3/ (15)) ≈ 142.2 deg, (11) where θ2 = 90 deg θ3 φ1 √ = 90 − tan (1/ 15 ≈ 75.5 deg, √ = 180 − tan−1 (1/ 15) ≈ 104.5 deg −1 so θ ≈ −23.3 deg. (12) (13) (14) The resulting plot should look something like that shown in Figure 1. This plot and other calculations and plots for this problem are generated by the matlab script % % % % % two.m solves part of problem 2 from Fall 08 HW5 18 November 08 --sk th1 = 180-atand(3/sqrt(15)) th2 = 90; th3 = 90 - atand(1/sqrt(15)) ph1 = 90 + atand(1/sqrt(15)) th = 180 - th1 - 90 - th3 + ph1 nump = conv([1 2 0],[1 3 6]) % modulo sign numdp = conv(nump(1:4).*[4 3 2 1],[1 1])-nump pbps = roots(numdp) ECE382/ME482 Fall 2008 Homework 5 Solution November 18, 2008 4 Figure 1: Root locus generated by Matlab Problem 1 Root Locus 6 4 Imaginary Axis 2 0 −2 −4 −6 −7 −6 −5 −4 −3 −2 Real Axis −1 0 1 figure(1) rlocus(tf([1 1],[1 5 12 12 0])); title(’Root Locus’) print -depsc two K = 0; cl_tf_den = [1 5 12 (12+K) 5*K]; cl_poles = roots([1 5 12 (12+K) 5*K]) Tsc = (4/.6)/2.43 figure(3) K = 10; bode(tf(K*[1 1],cl_tf_den)); grid title(’Frequency Response of Closed Loop System with K = 10’) print -depsc twoc 2 ECE382/ME482 Fall 2008 Homework 5 Solution November 18, 2008 5 √ Clicking on the root locus corresponding to 3/2 + 15/2 in the plot obtained using Matlab, we see that the gain corresponding to maximum ζ is 0, yielding ζ ≈ 0.6. (b) If we use K = 0, the closed loop transfer function is the same as the open loop transfer function. √ (c) Clicking on the pole at 3/2 + 15/2 we see that Matlab predicts overshoot of 9.26% and ωn = 2.43 rad/s, which would yield a 2%-settling time of Ts2% ≈ 4 ≈ 4.12 s ζωn (15) (d) The actual step response is zero because the closed loop transfer function had the gain K in the numerator. This suggests that we should be rather cautious in using the estimated values of natural frequency and damping coefficient provided by Matlab. Another reason that these values may not be very helpful is that they presumably represent the values associated with the particular complex pair only. Other complex poles and/or zeros may also affect the closed loop response. (e) I meant the plot for the closed loop system, but didn’t say so. Either the open loop or the closed loop is acceptable here. The frequency response plot for the closed-loop system is shown in Figure 2. (3) Consider the unity negative feedback system whose forward path consists of a controller having transfer function Gc (s) and a plant having transfer function Gp (s) with Gp (s) = 1 . s(s + 2)(s + 5) (16) Sketch the root loci for the system with the following controllers: (a) Gc (s) = K, (b) Gc (s) = K(s + 1), (c) Gc (s) = K(s + 1)/(s + 2), and (d) Gc (s) = K(s + 1)(s + 2)/(s + 3). Solution: K (a) Gc (s) = K, leads to Gc Gp (s) = s(s+2)(s+5) . The root locus for this system can be obtained as in problem 2 with the extra step of finding the breakout point. We will need a breakaway point on the segment of the real axis from −2 to 0 because these two poles must go to zeros either of the numerator or at ∞. To determine the break point we put 1+ k s(s + 2)(s + 5) (17) over a common denominator and set the numerator equal to zero. This yields p(s) = K = −(s3 + 7s2 + 10s). (18) Now we take the partial derivative of p(s) with respect to s and set it equal to zero. The roots are candidate break points. We obtain − ∂p(s) ∂s = −3s2 − 14s − 10 (19) ECE382/ME482 Fall 2008 Homework 5 Solution November 18, 2008 6 Figure 2: Problem 2(e) Frequency Response of Closed Loop System with K = 10 20 Magnitude (dB) 0 −20 −40 −60 −80 −100 −90 Phase (deg) −135 −180 −225 −270 −1 10 0 1 10 10 2 10 Frequency (rad/sec) which has roots s ≈ −0.88 and −3.79 (obtained using Matlab). Since the breakout point must be between 0 and -2, we see that the breakout point is approximately -0.88. The root locus as generated by Matlab is shown in Figure 3. Your hand-drawn root locus should be similar. K(s+1) (b) Gc (s) = K(s + 1), leads to Gc Gp (s) = s(s+2)(s+5) . The root locus as generated by Matlab is shown in Figure 4. Your hand-drawn root locus should be similar. K(s+1) (c) Gc (s) = K(s + 1), leads to Gc Gp (s) = s(s+2) 2 (s+5) . The root locus as generated by Matlab is shown in Figure 5. Your hand-drawn root locus should be similar. K(s+1) (d) Gc (s) = K(s + 1), leads to Gc Gp (s) = s(s+3)(s+5) . The root locus as generated by Matlab is shown in Figure 6. Your hand-drawn root locus should be similar. (4) We are asked to find the Bode plots for the systems of the previous problem. Solution: ECE382/ME482 Fall 2008 Homework 5 Solution November 18, 2008 7 Figure 3: Problem 3(a) Problem 3a Root Locus 10 8 6 Imaginary Axis 4 2 0 −2 −4 −6 −8 −10 −14 −12 −10 (a) Gc (s) = 1, leads to Gc Gp (s) = −8 −6 −4 Real Axis 1 s(s+2)(s+5) . T (s) = s3 −2 0 2 4 The closed loop transfer function is + 7s2 1 + 10s + 1 (20) The Bode plot as generated by Matlab is shown in Figure 7. Your hand-drawn Bode plot should be similar. (b) Gc (s) = (s + 1), leads to Gc Gp (s) = (s+1) s(s+2)(s+5) . T (s) = The closed loop transfer function is s+1 s3 + 7s2 + 11s + 1 (21) The Bode plot as generated by Matlab is shown in Figure 8. Your hand-drawn Bode plot should be similar. (c) Gc (s) = (s + 1), leads to Gc Gp (s) = (s+1) s(s+2)2 (s+5) . ECE382/ME482 Fall 2008 Homework 5 Solution November 18, 2008 8 Figure 4: Problem 3(b) Problem 3b Root Locus 8 6 4 Imaginary Axis 2 0 −2 −4 −6 −8 −5 −4.5 −4 −3.5 −3 −2.5 Real Axis −2 −1.5 −1 −0.5 0 The closed loop transfer function is T (s) = s3 + s+1 + 25s + 21 9s2 (22) The Bode plot as generated by Matlab is shown in Figure 9. Your hand-drawn Bode plot should be similar. (d) Gc (s) = (s + 1), leads to Gc Gp (s) = (s+1) s(s+3)(s+5) . The closed loop transfer function is T (s) = s3 s+1 + 8s2 + 16s + 1 (23) The Bode plot as generated by Matlab is shown in Figure 10. Your hand-drawn Bode plot should be similar. (5) Consider the system having open loop transfer function G(s) = K(s + 1) s2 + 2s (24) ECE382/ME482 Fall 2008 Homework 5 Solution November 18, 2008 9 Figure 5: Problem 3(c) Problem 3c Root Locus 10 8 6 Imaginary Axis 4 2 0 −2 −4 −6 −8 −10 −16 −14 −12 −10 −8 −6 Real Axis −4 −2 0 2 4 and unity negative feedback. (a) Find a value of K such that the damping factor of the closed loop poles is ζ = 0.707. (b) Plot the root loci. (c) Plot the Bode plot for the value of K chosen in part (a). Solution: (a) The closed loop transfer function is T (s) = Since ωn = K(s + 1) . s2 + (2 + K)s + K (25) √ √ K, ζ = (2 + K)/(2 K) so we must solve 0.707 = 2+K √ 2 K (26) for K. Rearranging, we find that √ 0.707(2) K = 2 + K (27) ECE382/ME482 Fall 2008 Homework 5 Solution November 18, 2008 10 Figure 6: Problem 3(d) Problem 3d Root Locus 15 10 Imaginary Axis 5 0 −5 −10 −15 −5 −4.5 −4 −3.5 −3 −2.5 Real Axis −2 −1.5 −1 −0.5 0 or (0.707)2 (2)2 K = 4 + 2K + K 2 (28) and thus K = (2 − 4(0.707) ± p (2 − 4(0.707))2 − 16)/2 = −0.414 ± 1.956j so no K exists that satisfies the design requirement. (b,c) The root locus is given in Figure 11. To generate the Bode plot, shown in Figure 12 I chose K = 1. (29) ECE382/ME482 Fall 2008 Homework 5 Solution November 18, 2008 11 Figure 7: Problem 4(a) Problem 4a Bode Diagram 0 −20 −40 Magnitude (dB) −60 −80 −100 −120 −140 −160 −180 −200 Phase (deg) 0 −90 −180 −270 −3 10 −2 10 −1 10 0 10 Frequency (rad/sec) 1 10 2 10 3 10 ECE382/ME482 Fall 2008 Homework 5 Solution November 18, 2008 12 Figure 8: Problem 4(b) Problem 4b Bode Diagram 0 −10 Magnitude (dB) −20 −30 −40 −50 −60 −70 −80 0 Phase (deg) −45 −90 −135 −180 −3 10 −2 10 −1 10 Frequency (rad/sec) 0 10 1 10 2 10 ECE382/ME482 Fall 2008 Homework 5 Solution November 18, 2008 13 Figure 9: Problem 4(c) Problem 4c Bode Diagram 0 −20 −40 Magnitude (dB) −60 −80 −100 −120 −140 −160 −180 −200 Phase (deg) 0 −90 −180 −270 −3 10 −2 10 −1 10 0 10 Frequency (rad/sec) 1 10 2 10 3 10 ECE382/ME482 Fall 2008 Homework 5 Solution November 18, 2008 14 Figure 10: Problem 4(d) Problem 4d Bode Diagram 0 −10 Magnitude (dB) −20 −30 −40 −50 −60 −70 −80 0 Phase (deg) −45 −90 −135 −180 −3 10 −2 10 −1 10 Frequency (rad/sec) 0 10 1 10 2 10 ECE382/ME482 Fall 2008 Homework 5 Solution November 18, 2008 15 Figure 11: Problem 5(b) Problem 5 Root Locus 1 0.8 0.6 Imaginary Axis 0.4 0.2 0 −0.2 −0.4 −0.6 −0.8 −1 −6 −5 −4 −3 Real Axis −2 −1 0 ECE382/ME482 Fall 2008 Homework 5 Solution November 18, 2008 16 Figure 12: Problem 5(c) Problem 5 Bode Plot with K = 1 0 −5 Magnitude (dB) −10 −15 −20 −25 −30 −35 −40 Phase (deg) 0 −45 −90 −2 10 −1 10 0 10 Frequency (rad/sec) 1 10 2 10


